Power BI integration for portfolio management

By AMX Germany GmbH

Comprehensive project management with advanced data analysis and visualization capabilities, facilitating proactive decision-making and strategic planning. Visualize your Smartsheet data and utilize the drill-down capabilities and visuals of Power BI.

Manage projects, track team performances, and pinpoint bottlenecks through advanced data analysis.

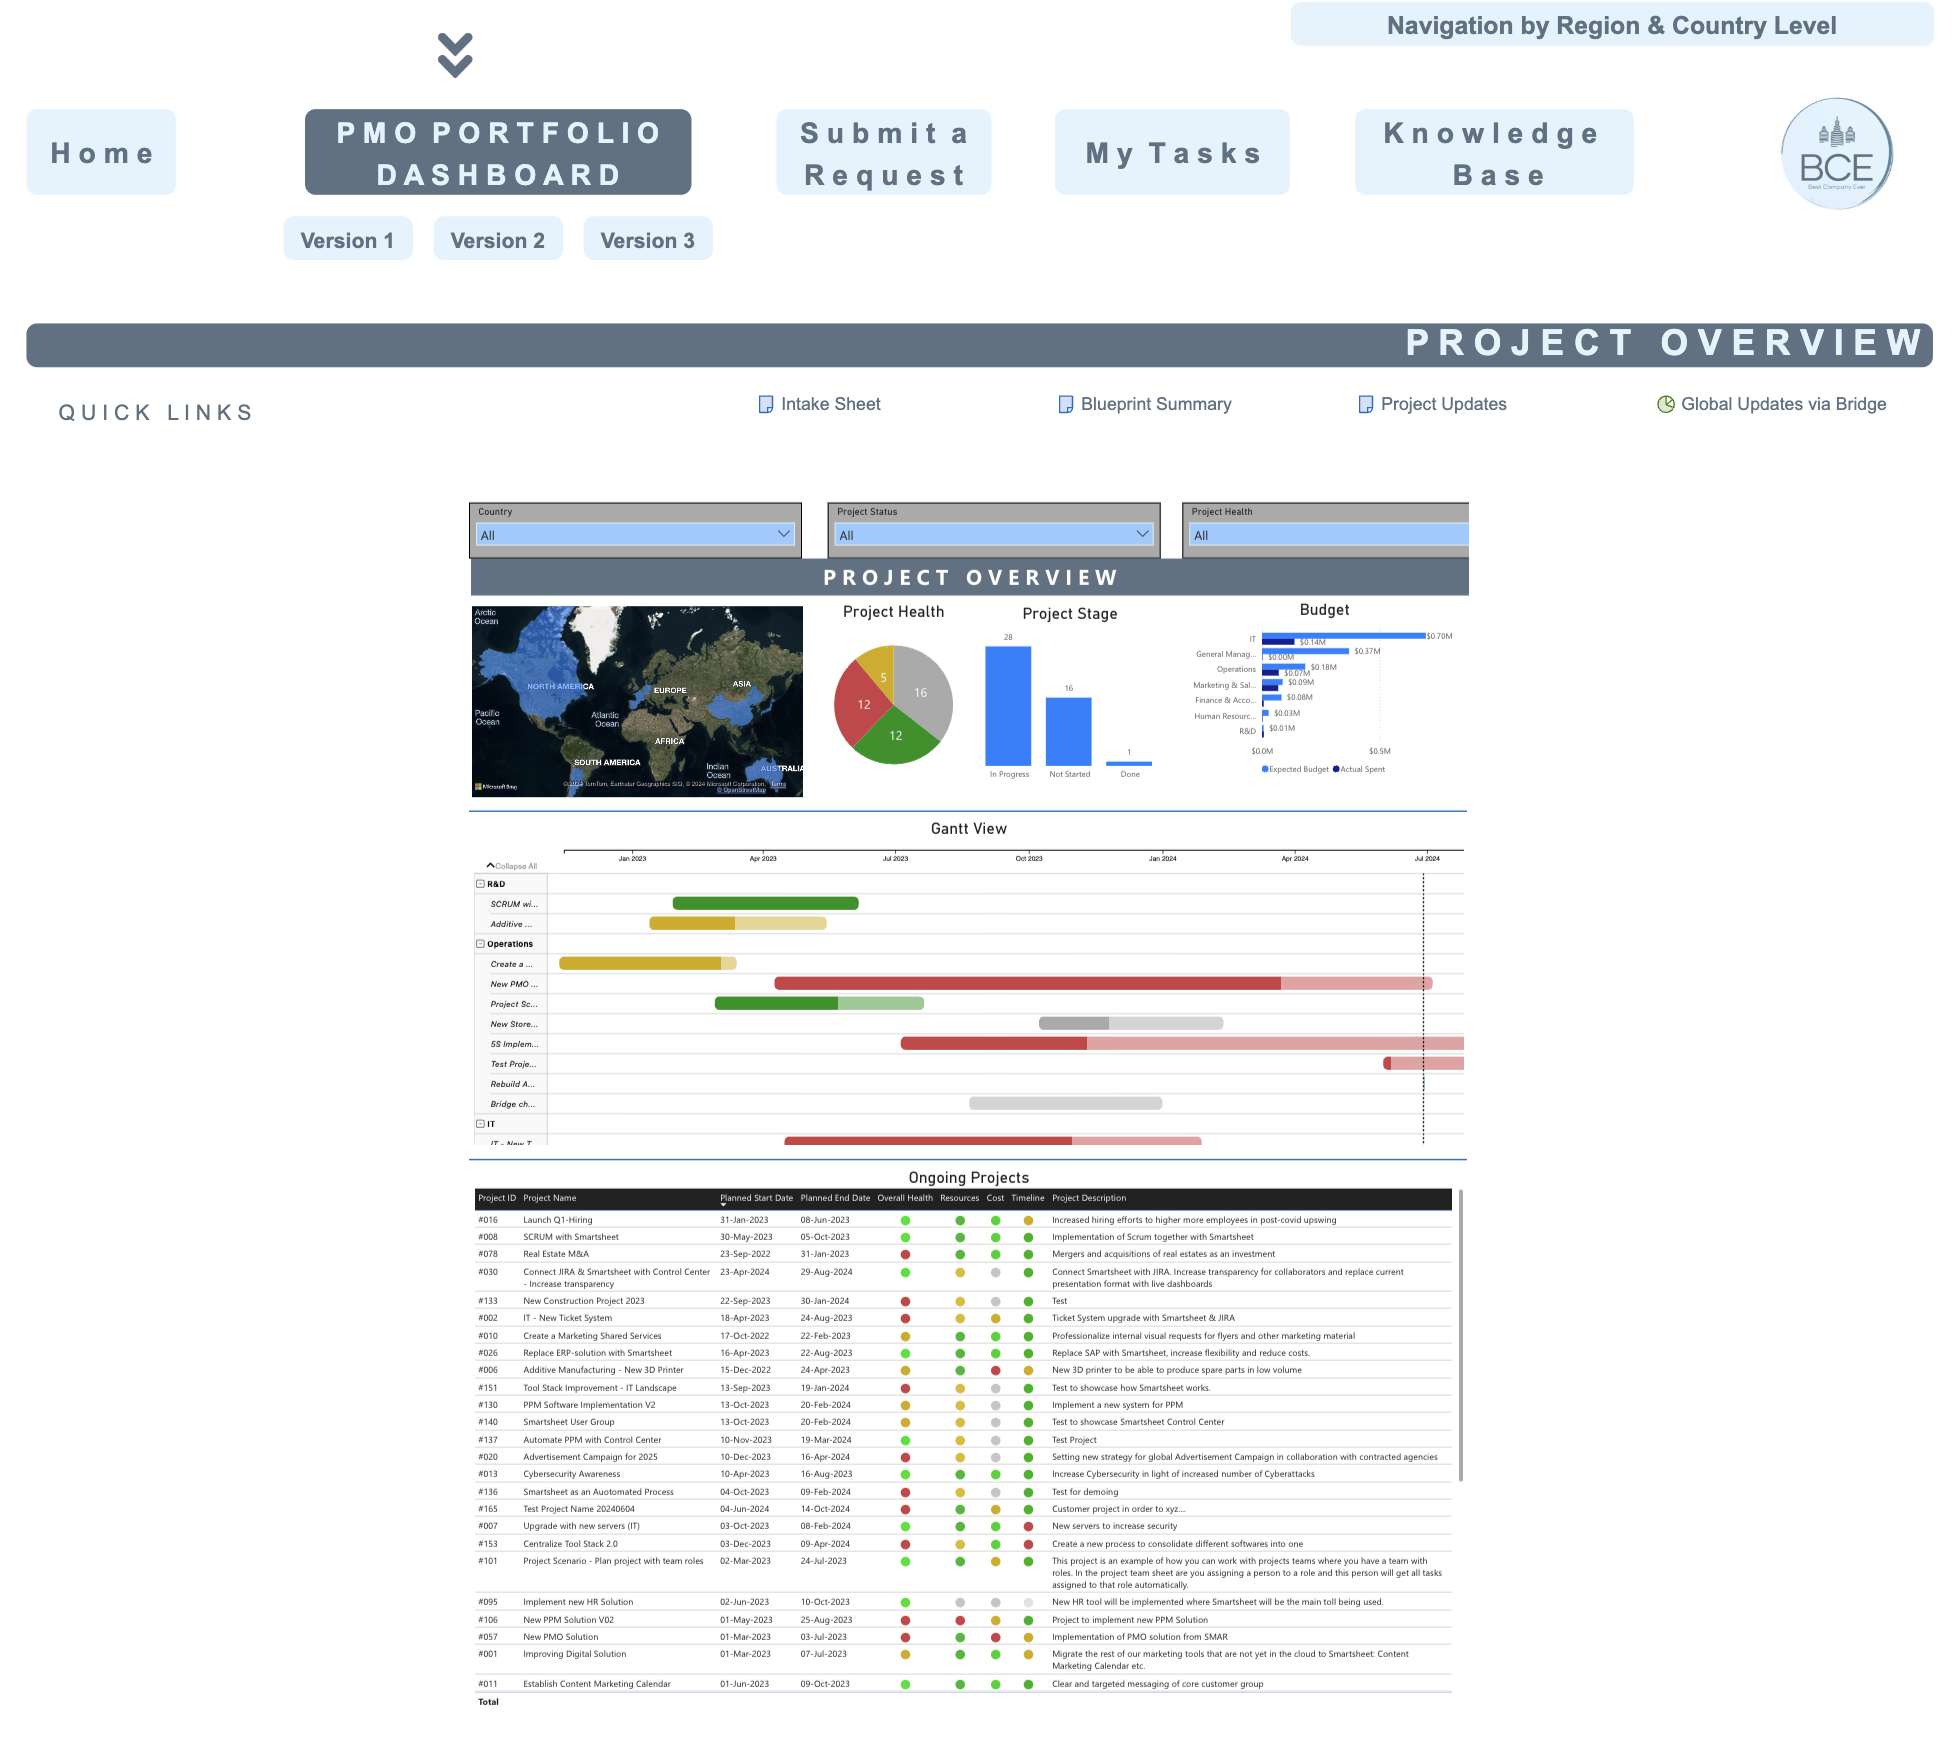
Combining Smartsheet's robust project management and collaboration capabilities with Power BI's interactive visualizations, slicer features, and advanced data analytics creates a powerful synergy that enhances project oversight and provides valuable strategic insights.

Power BI integration

Enhanced project oversight

By integrating Smartsheet's powerful project planning, task tracking, and collaboration tools with Power BI's interactive visualizations and advanced data analytics, organizations can streamline operations, achieve deeper insights into project performance, and make well-informed decisions. This synergy enables teams to optimize resource allocation, identify trends, and proactively address challenges, ultimately driving greater efficiency and success in project execution. 

Power BI integration

Portfolio-level risk matrix

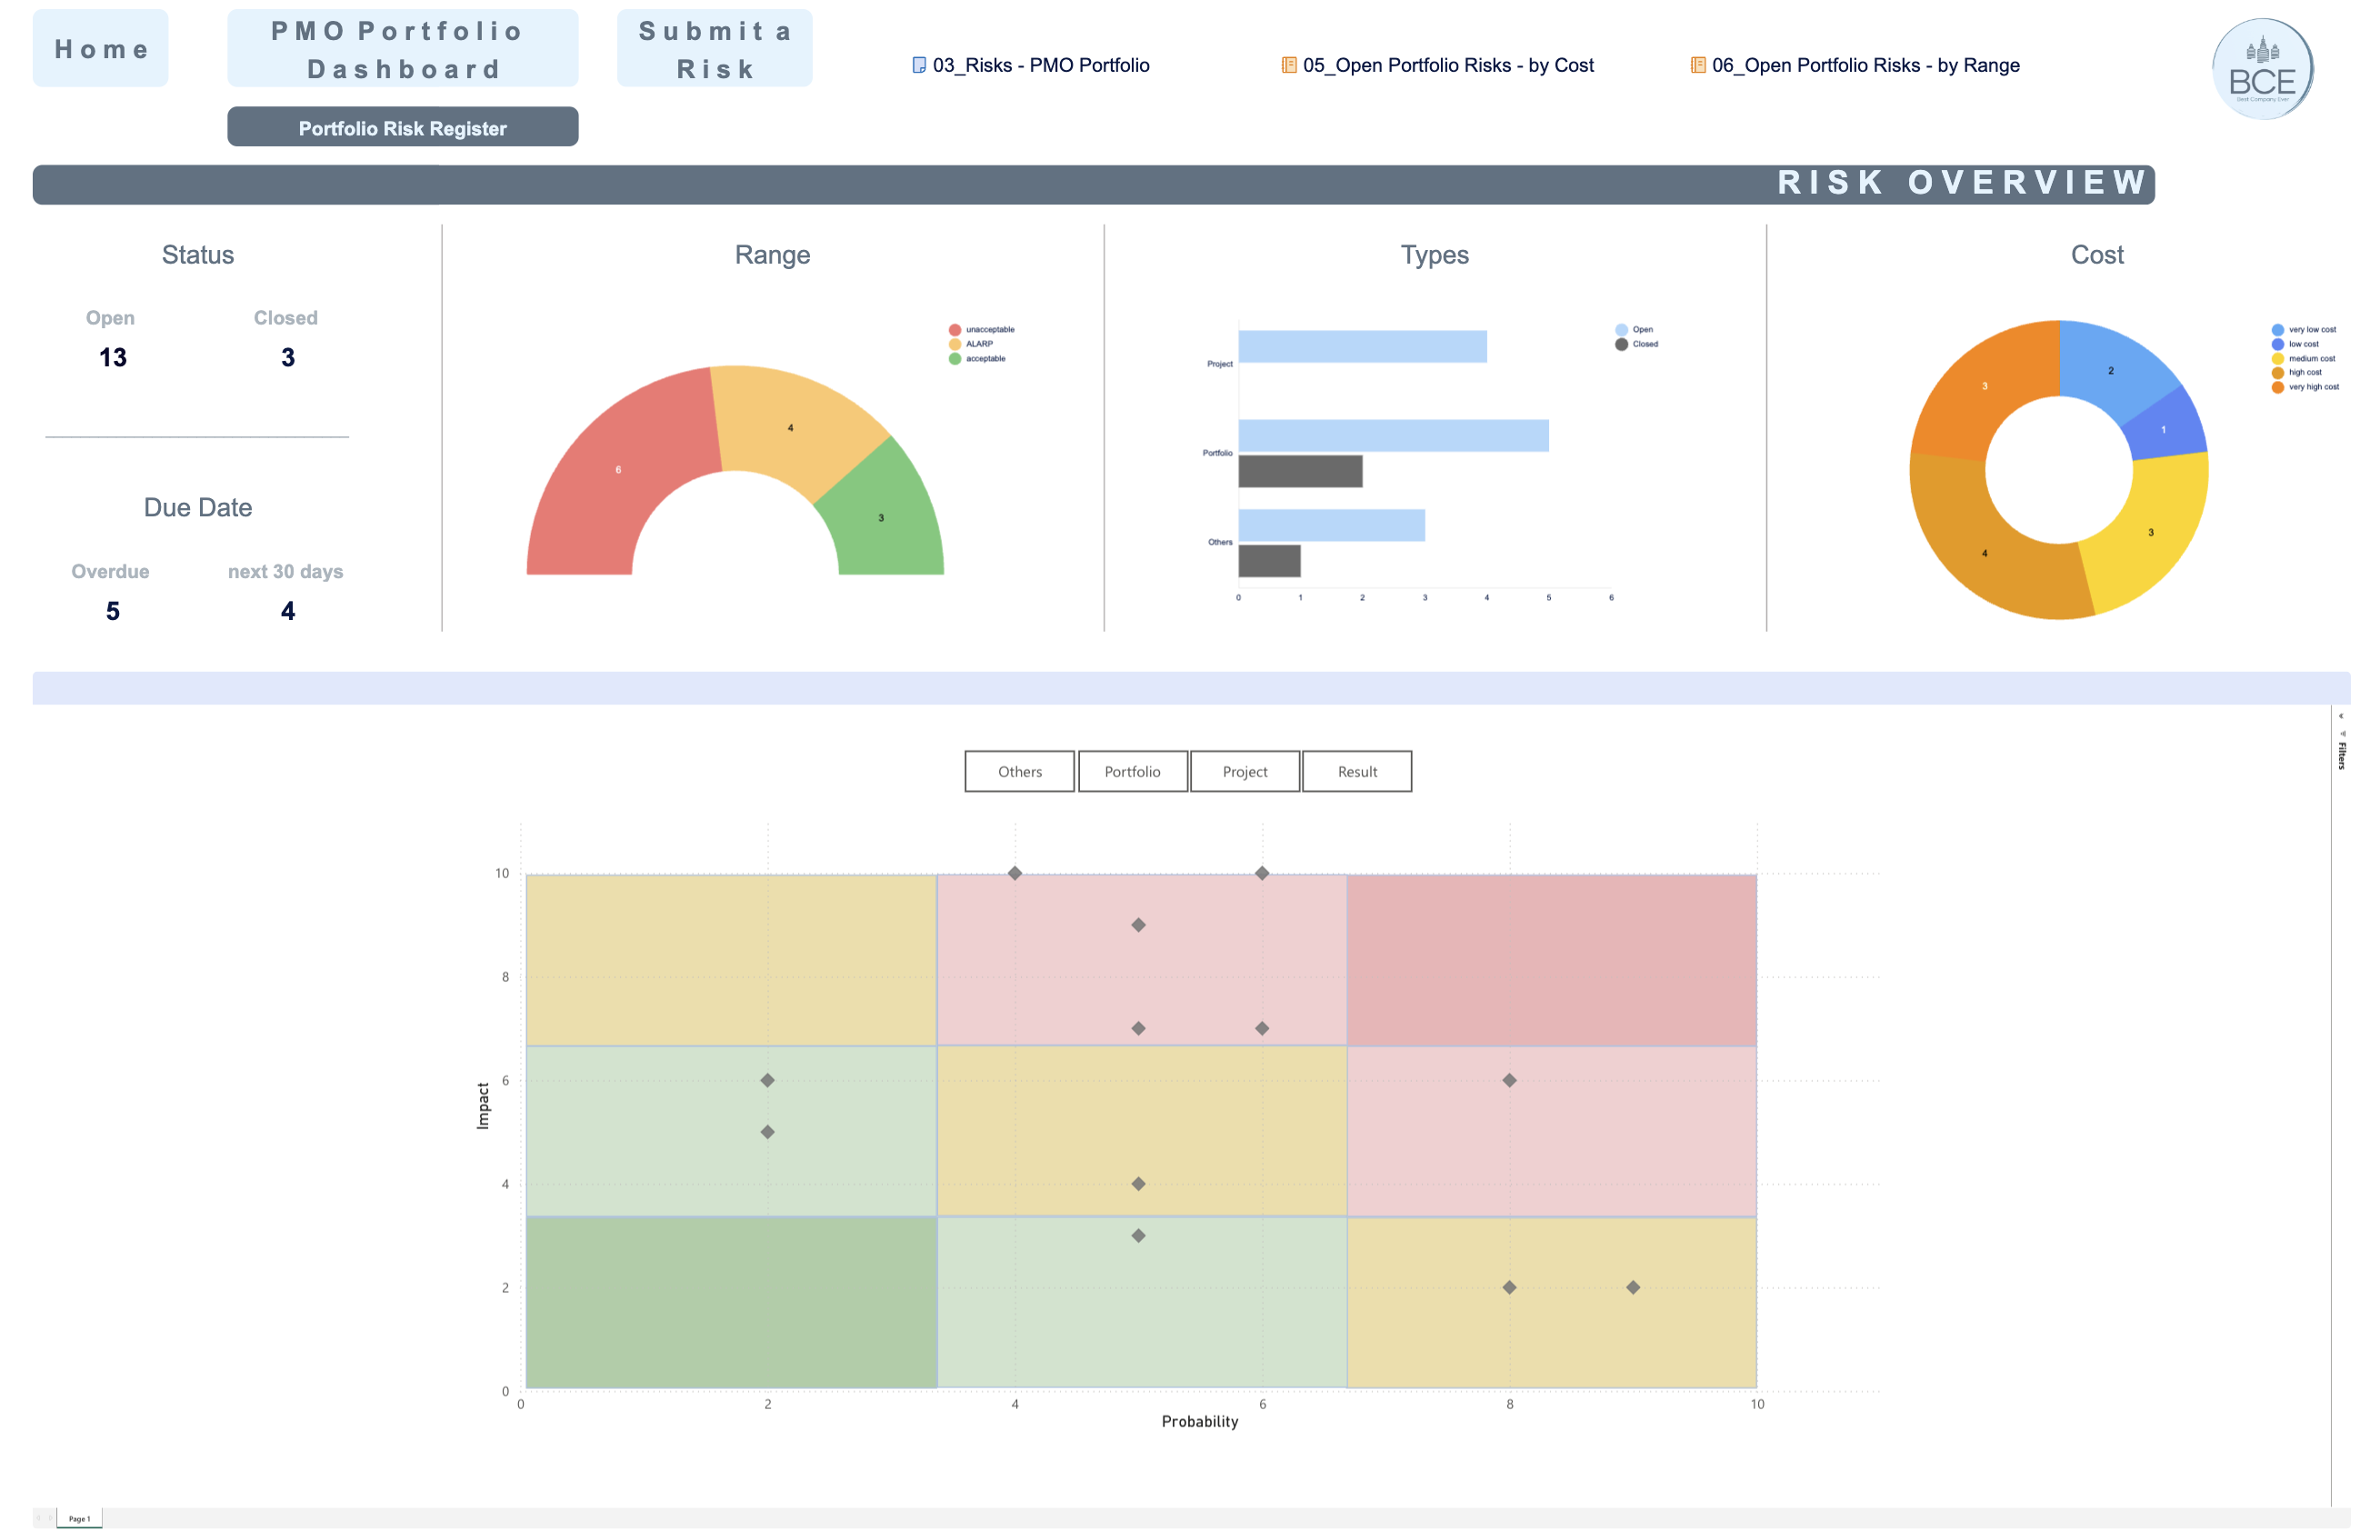
Integrating Power BI with Smartsheet for portfolio-level risk register management provides a consolidated view of project statuses, due dates, severity ranges, types, costs, and more. This integration enables visualizing the impact of risks through probability-to-impact graphs, enhancing proactive risk mitigation strategies. Power BI's advanced analytics capabilities, along with interactive charts and graphs, allow for deeper insights into risk profiles and impacts, thereby improving the overall efficiency of portfolio risk management.

PowerBI AMX

Financial insights and efficiency with Smartsheet and Power BI

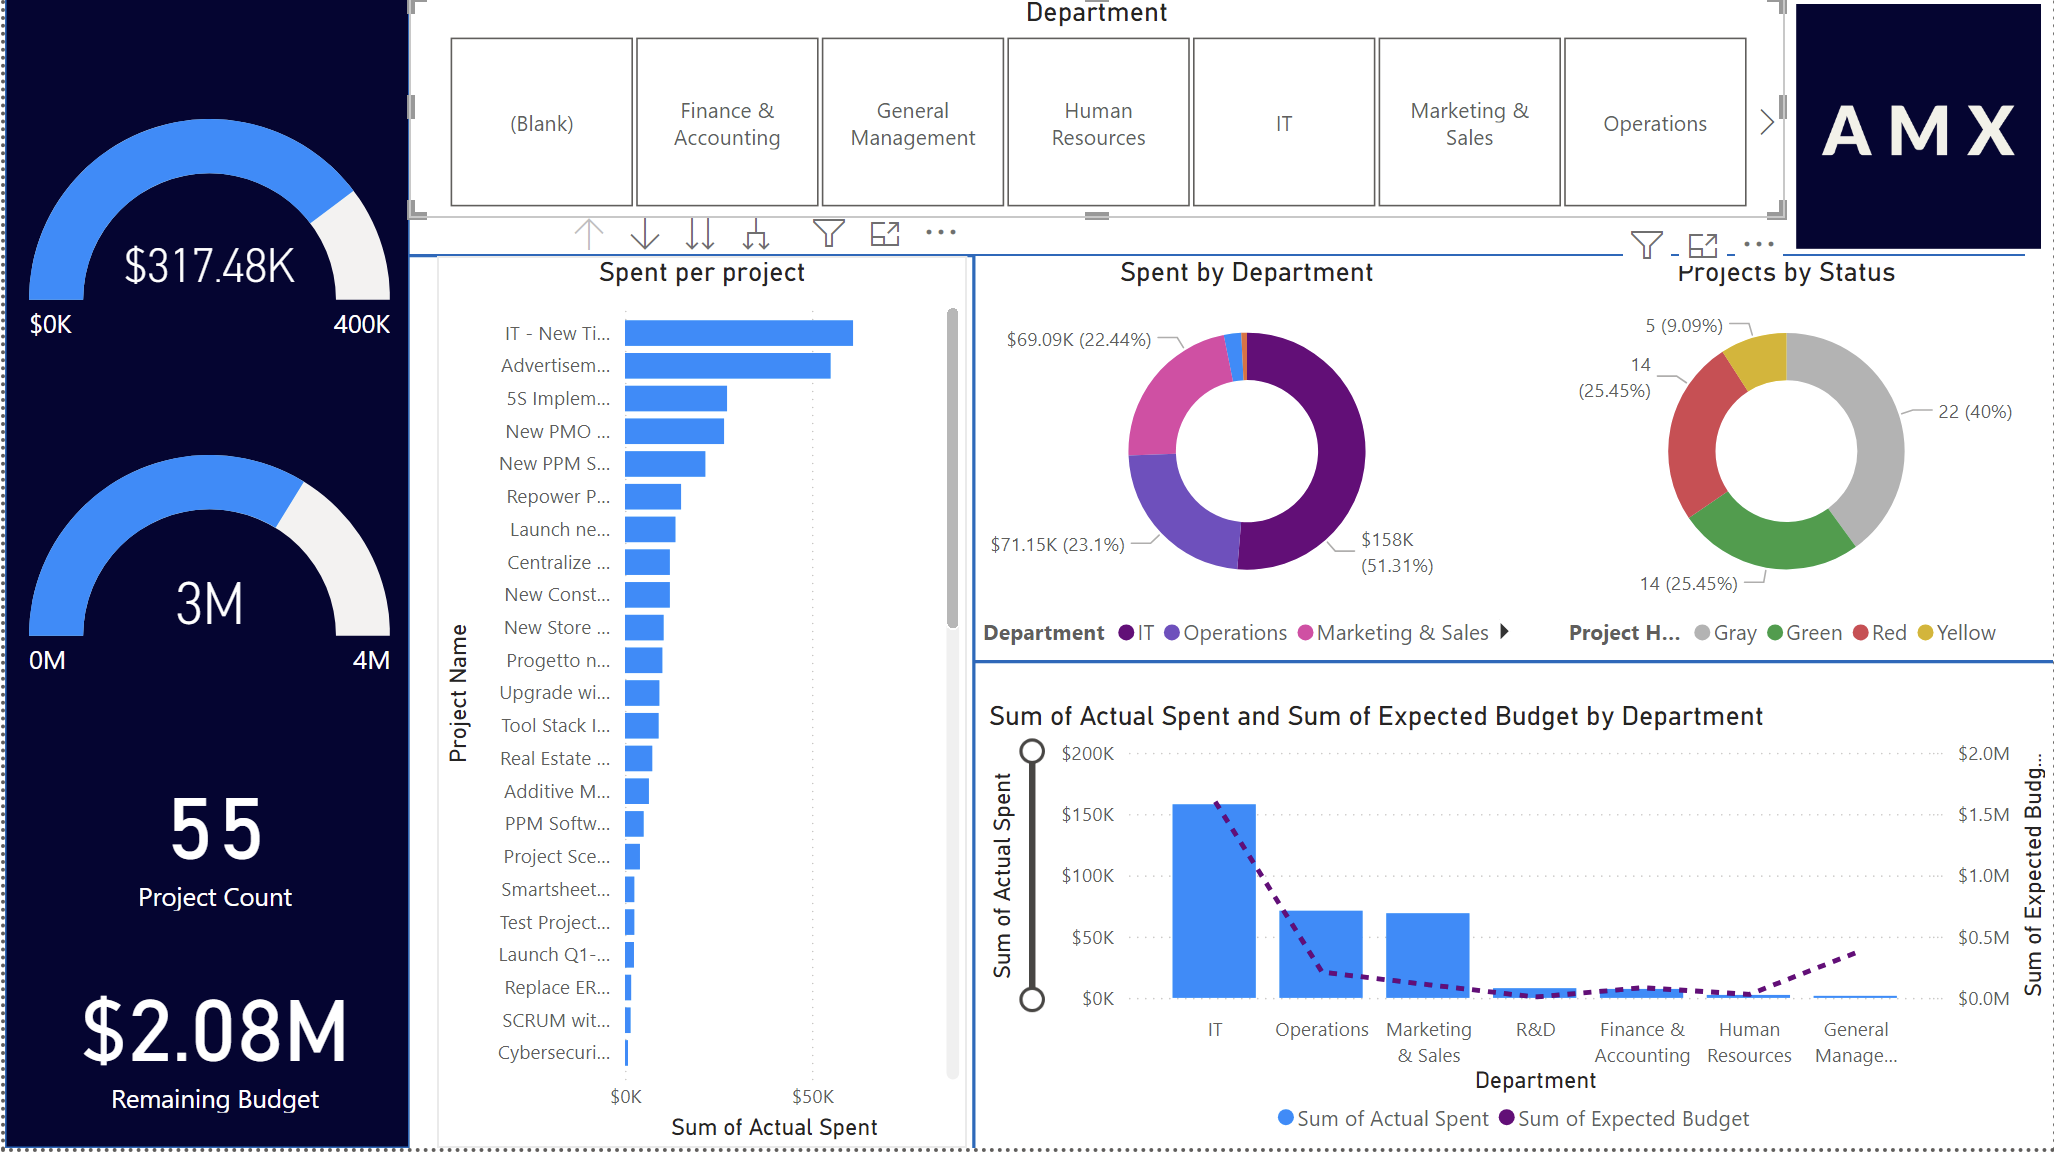
Enhancing financial capabilities with Smartsheet and Power BI involves gaining real-time insights into budgets, expenses, and financial forecasts across projects. This synergy facilitates informed decision-making, ensures budget adherence, and optimizes strategic resource allocation, thereby fostering financial transparency and operational efficiency. The utilization of slicers, filters, and interactive graphs allows users to dynamically explore and visualize financial data, enhancing clarity and enabling proactive management actions.

Explore the synergy between Smartsheet's project management capabilities and Power BI's advanced analytics. Streamline operations, gain deeper insights, and drive productivity like never before.

How to get it:

Check the use case scenario, learn how we can help you and contact AMX  to discuss your needs and discover tailored solutions, examples, and use cases.