One-Month Gantt Chart Template
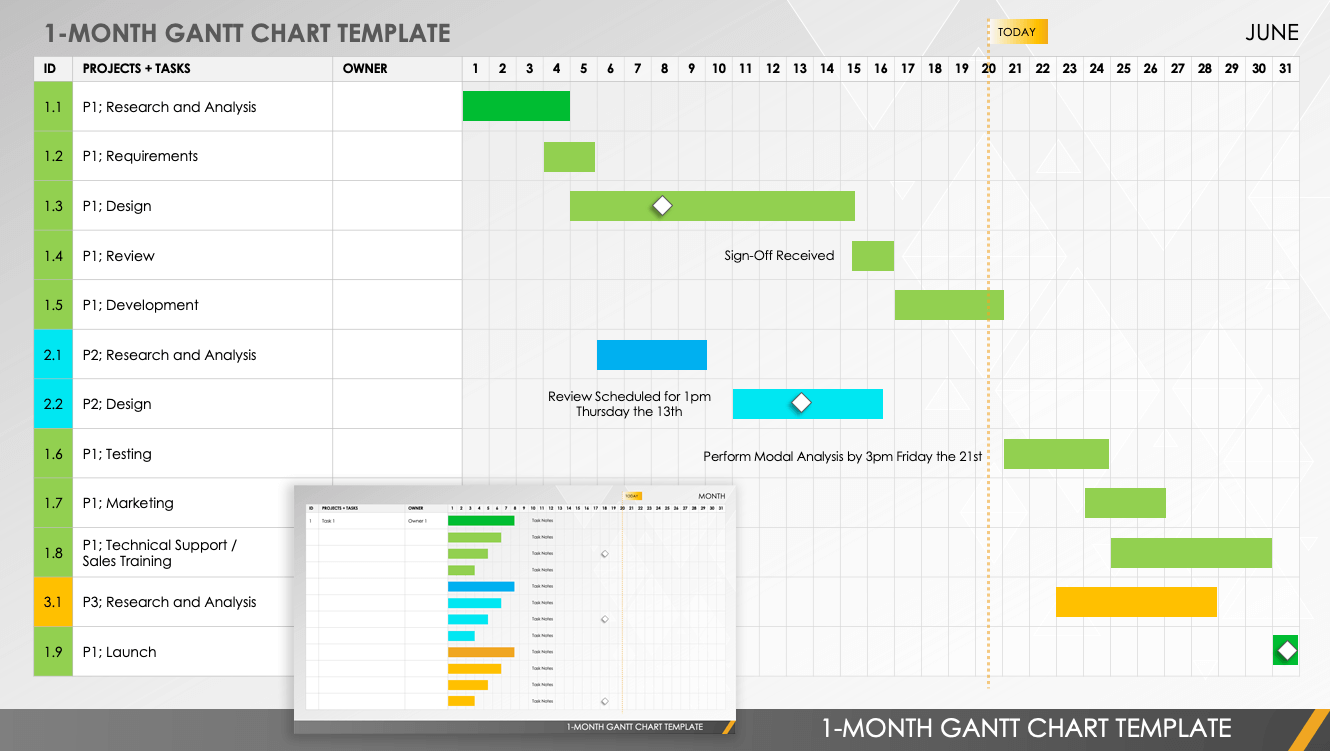
Create a one-month Gantt chart schedule for your project. Enter the month at the top of the template, and then use the Gantt chart to show the timeline for each task. This template makes scheduling easy by displaying every day of the month, and also includes a column for assigning task owners.
Download One-Month Gantt Chart Template
Transform your project details into an easy-to-read Gantt chart with Smartsheet
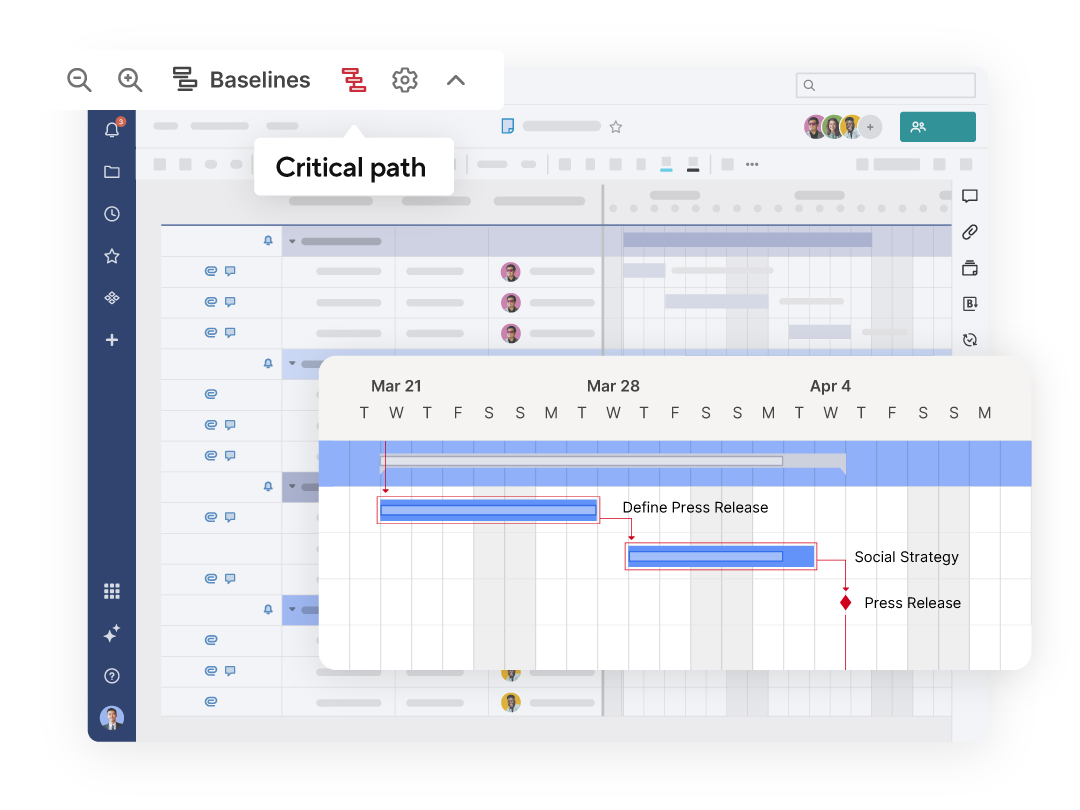
Smartsheet Gantt charts are a powerful tool for project planning, scheduling, and progress tracking. Display tasks across time with horizontal bars, view dependencies between tasks with ease, highlight important milestones, and identify a project's critical path to prioritize essential tasks.
Explore the full range of robust features when you try Smartsheet free for 30 days.
Three-Month Gantt Chart Template
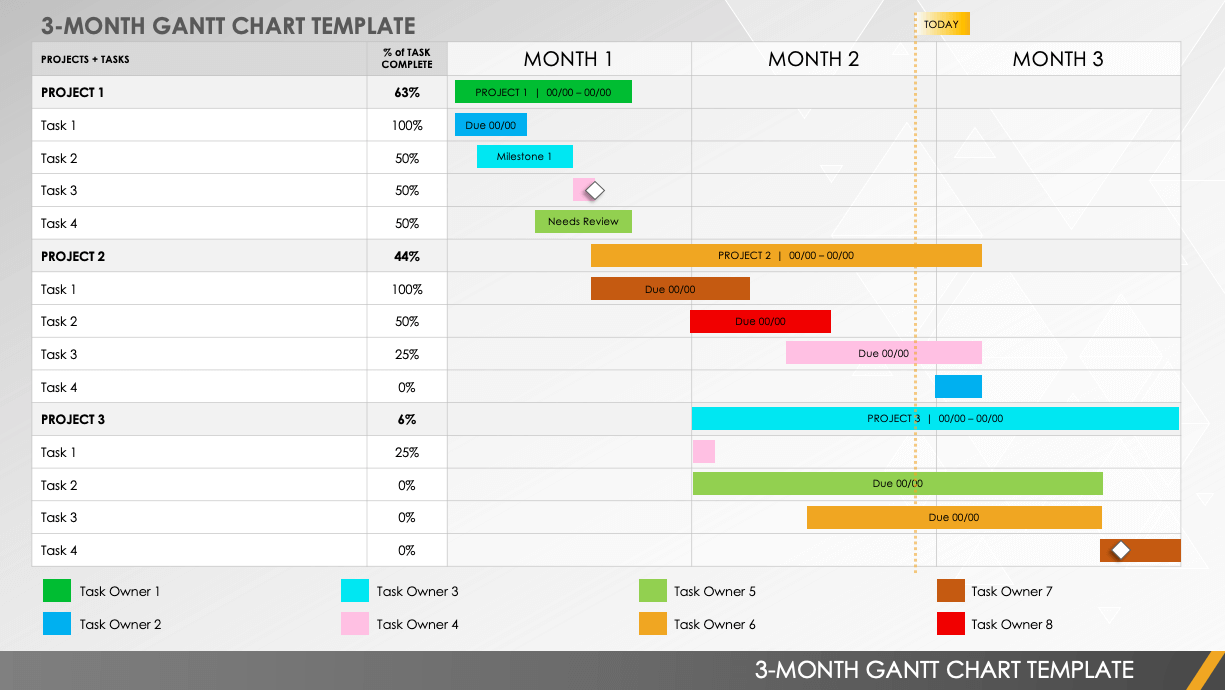
This template offers a three-month project timeline. Keep track of your progress by listing the percent complete for each task, and use the color-coded bars to represent different task owners. Additionally, use the color key at the bottom of the template to assign a team or individual to each project activity. To create a detailed schedule, add start and end dates to each bar.
Download Three-Month Gantt Chart Template
Four-Month Gantt Chart Template
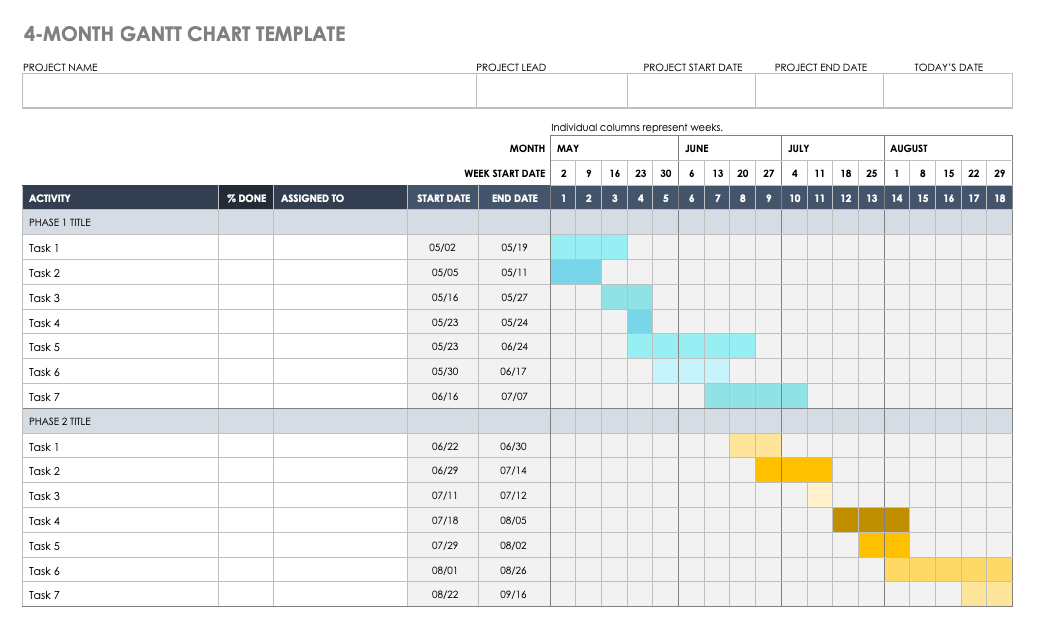
Track project phases or multiple projects over a four-month period. This template includes columns for project activities, task owners, start dates, and deadlines. The Gantt chart also includes four sections (one for each month), which are divided into weeks. Track project status by updating the percent complete for each task. Adjust the months and weeks on the Gantt chart to create your own project calendar.
Six-Month Project Gantt Chart Template
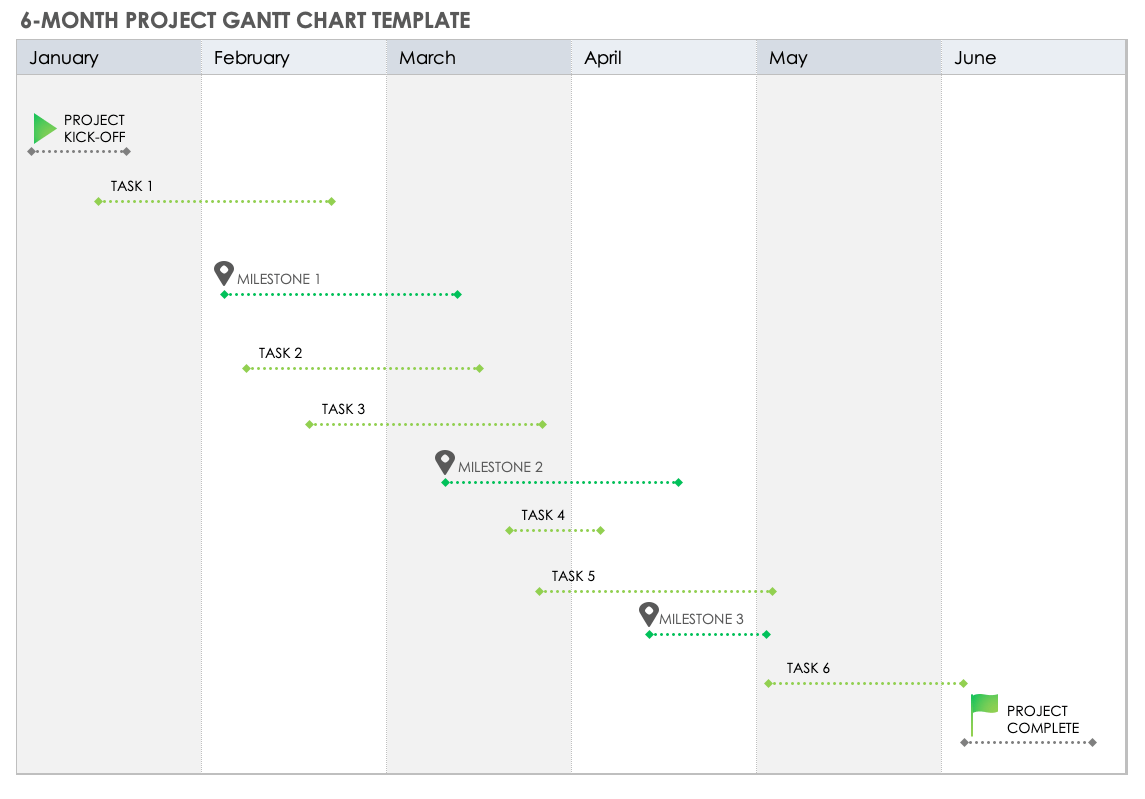
Enter your project start date to automatically adjust the months on this Gantt chart template, and add tasks and milestones to create a six-month project plan. Edit the text to include any details that you want to track, such as task status, owner, or due date. This template offers a clean design for a quick snapshot of your project schedule.
12-Month Project Gantt Chart Template
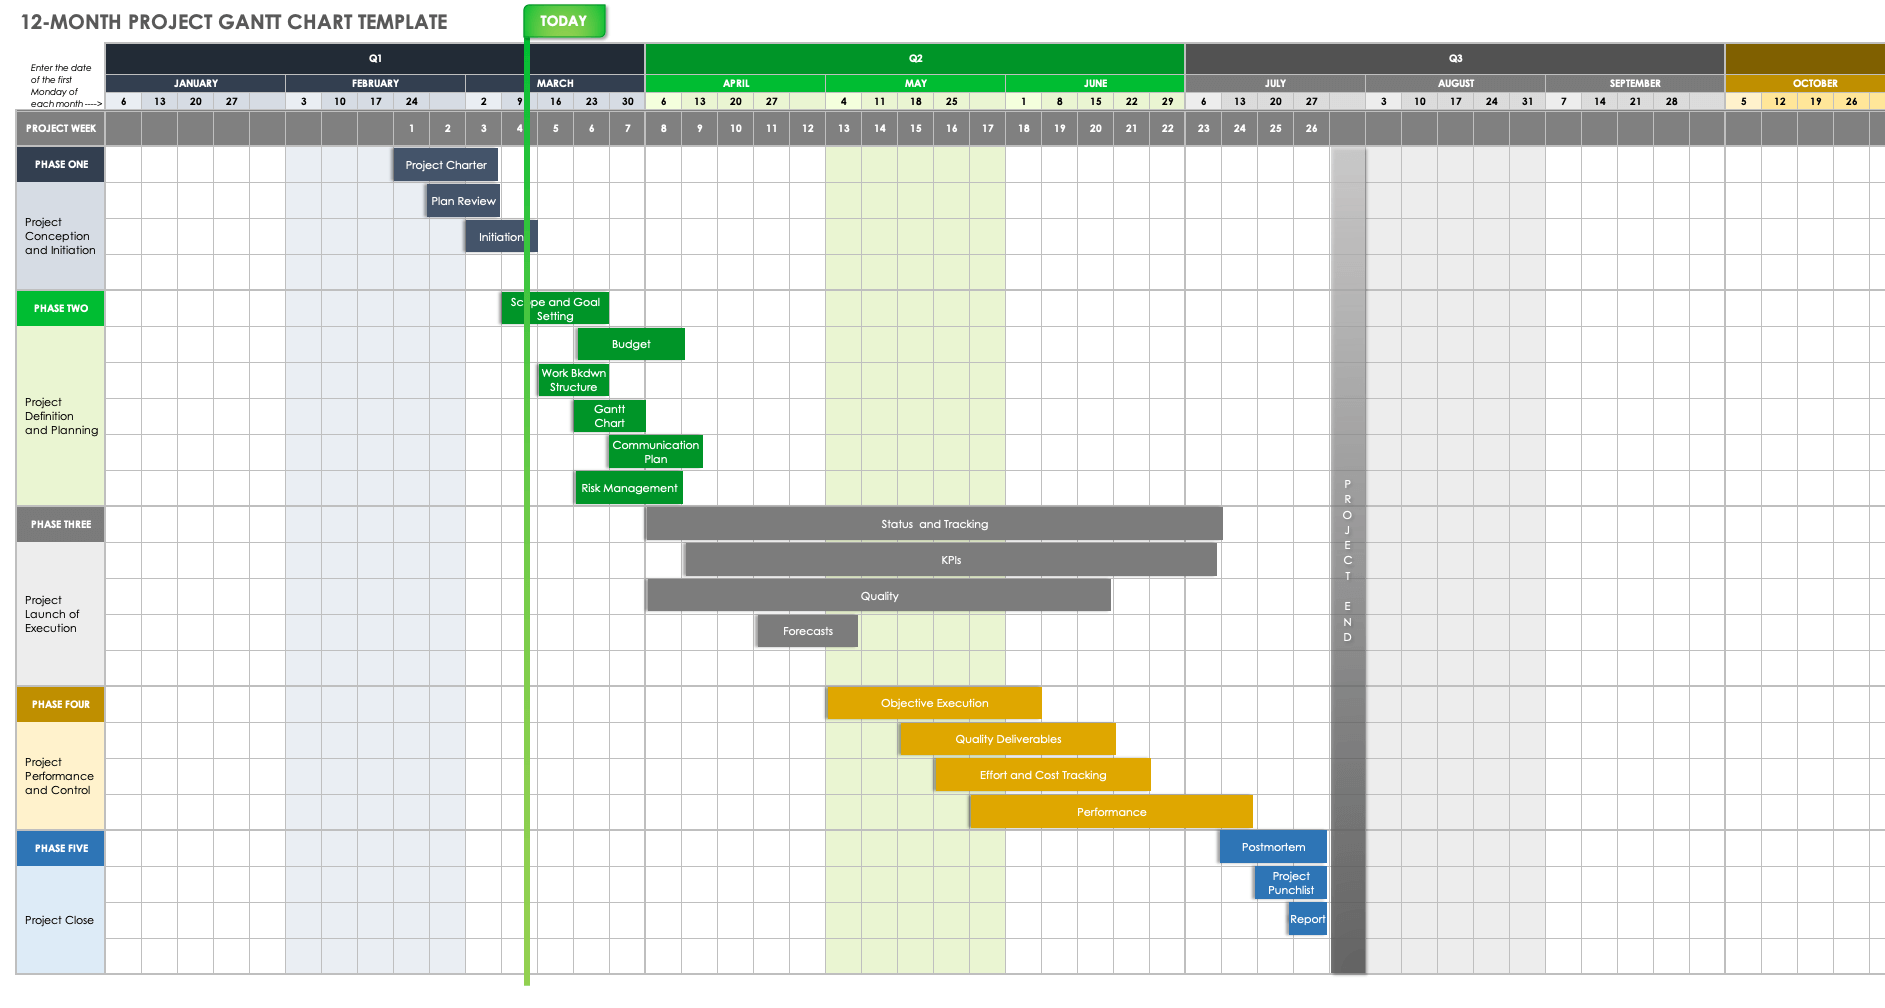
This Gantt chart template displays all 12 months by grouping the year in quarters and dividing it into project weeks. The template separates the project into phases, and assigns a different color to each phase. The chart includes markers for today’s date as well as the project end date. To create a monthly timeline, label each Gantt chart bar with a project task.
Download 12-Month Project Gantt Chart Template
Monthly Product Release Gantt Chart
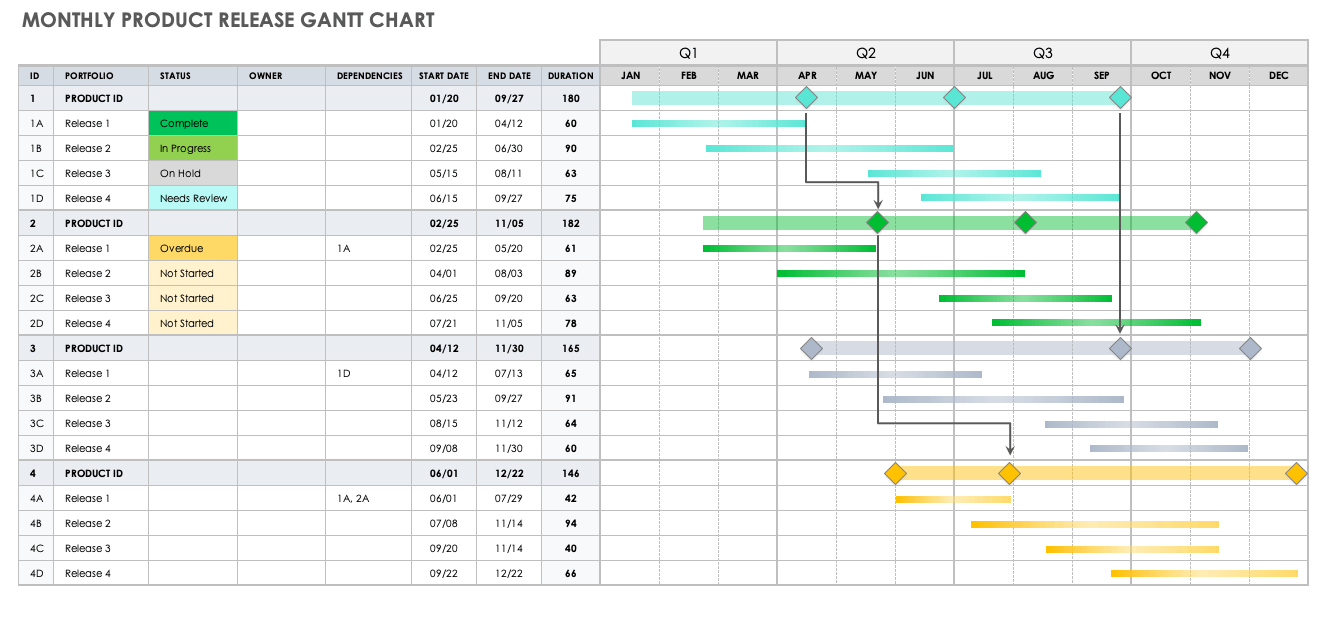
This template includes months and quarters, which allows you to manage multiple product releases on a single Gantt chart. Highlight dependencies between activities and mark any important milestones. Plan release activities, including start and end dates, and track the status of each task. You can easily modify this template to manage multiple projects on a monthly timeline.
Simple Monthly Gantt Chart Template
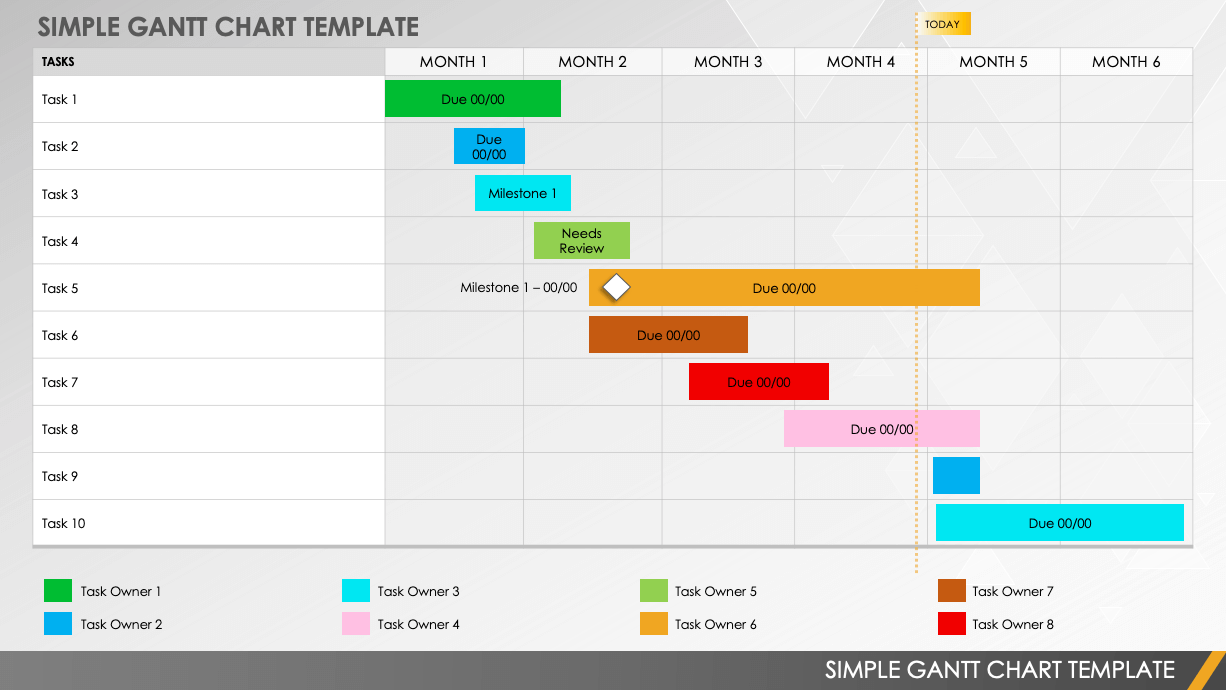
With a simple design and a basic layout, this Gantt chart template allows you to easily plan projects on a monthly and yearly basis. Use the color-coded bar chart to track any necessary data, such as task status or owner. Add activities to the template and adjust the timeline for each of those activities in order to create your own Gantt chart monthly calendar.
Create a Gantt Chart in Excel
For instructions on creating and customizing Gantt charts, see this post on creating a Gantt chart in Excel with a template. For a thorough understanding of this project management tool, including its purpose, pros and cons, origin, and other details, read our comprehensive guide to Gantt charts.
Make Better Decisions Faster with Monthly Gantt Charts in Smartsheet
From simple task management and project planning to complex resource and portfolio management, Smartsheet helps you improve collaboration and increase work velocity -- empowering you to get more done.
The Smartsheet platform makes it easy to plan, capture, manage, and report on work from anywhere, helping your team be more effective and get more done. Report on key metrics and get real-time visibility into work as it happens with roll-up reports, dashboards, and automated workflows built to keep your team connected and informed.
When teams have clarity into the work getting done, there’s no telling how much more they can accomplish in the same amount of time. Try Smartsheet for free, today.
