What Is a Gantt Chart?
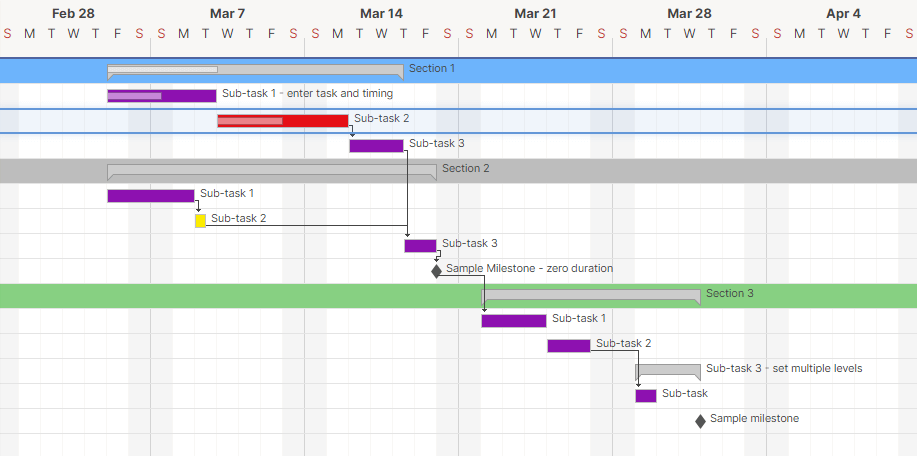
A Gantt chart is a type of bar chart that represents all the tasks in a project. It’s a project management tool used to plan project schedules, improve resource allocation, and remain up to date with project progress.
A Gantt chart has two main axis options. The vertical axis shows the list of tasks, and the horizontal axis represents the project timeline.
The chart itself features horizontal bars. Each bar represents a task, with the length of the bar showing when the task should start and end. As a result, project managers can use the chart to accurately predict the entire project timeline.
The Gantt chart became popular in the early 20th century. Henry Gantt, a mechanical engineer, began using the model to record the progress of each task in the manufacturing process. As a result, supervisors could see if production schedules were on time. If they weren’t, they could make changes to get things back on track.
Today, Gantt charts aren’t limited to the manufacturing industry. From software development to construction, Gantt charts can help a variety of teams manage their project schedules.
For more information on what a Gantt chart is, who uses a Gantt chart, the features of a Gantt chart, and the benefits of leveraging a Gantt chart in your project, visit our guide to Gantt charts.
Transform your project details into an easy-to-read Gantt chart with Smartsheet
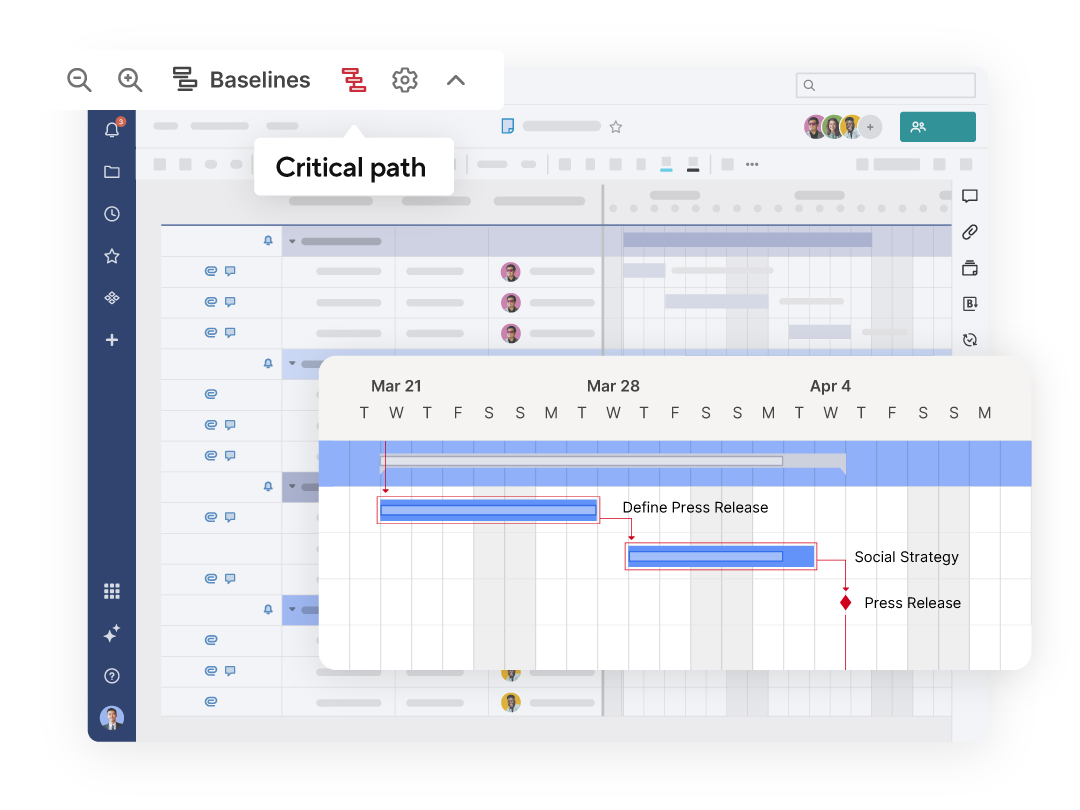
Smartsheet Gantt charts are a powerful tool for project planning, scheduling, and progress tracking. Display tasks across time with horizontal bars, view dependencies between tasks with ease, highlight important milestones, and identify a project's critical path to prioritize essential tasks.
Explore the full range of robust features when you try Smartsheet free for 30 days.
How to Make a Gantt Chart Online in Excel 2007 and Above
When it comes to creating a Gantt chart in Excel, you can either use a predesigned template or create your own from scratch.
To manually create a Gantt chart in Excel, follow these steps, which apply to both PCs and Macs.
1. Start by creating a data range in Excel that lists your project tasks, and their start and finish dates.
2. Select the data range that you want to make a Gantt chart for.
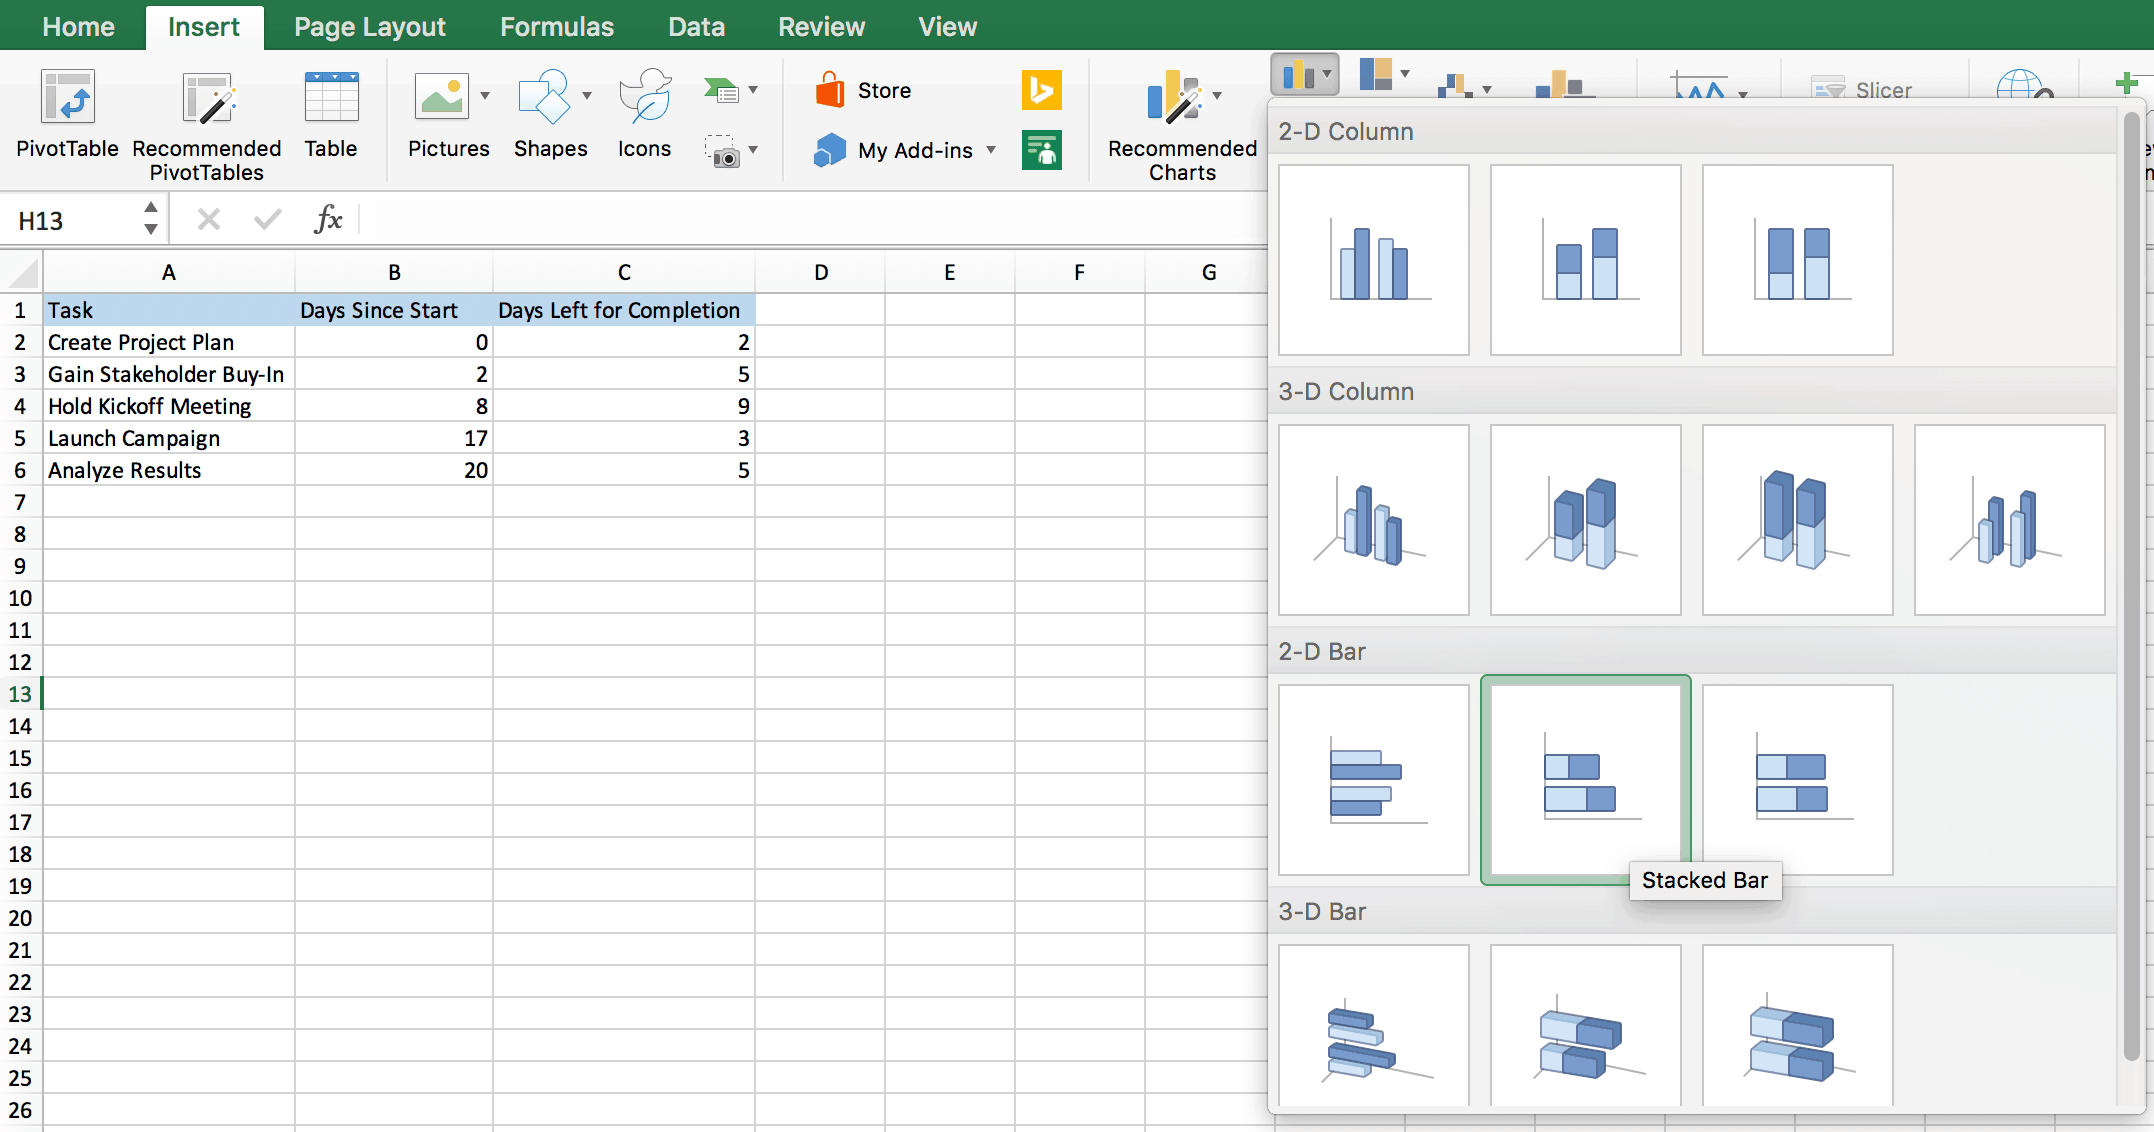
3. On the top navigation bar, select Insert on the menu ribbon.
4. In the Charts group, select the 2D Bar group, and click on the Stacked Bar option. The Stacked Bar is the closest option to a Gantt chart in Excel.
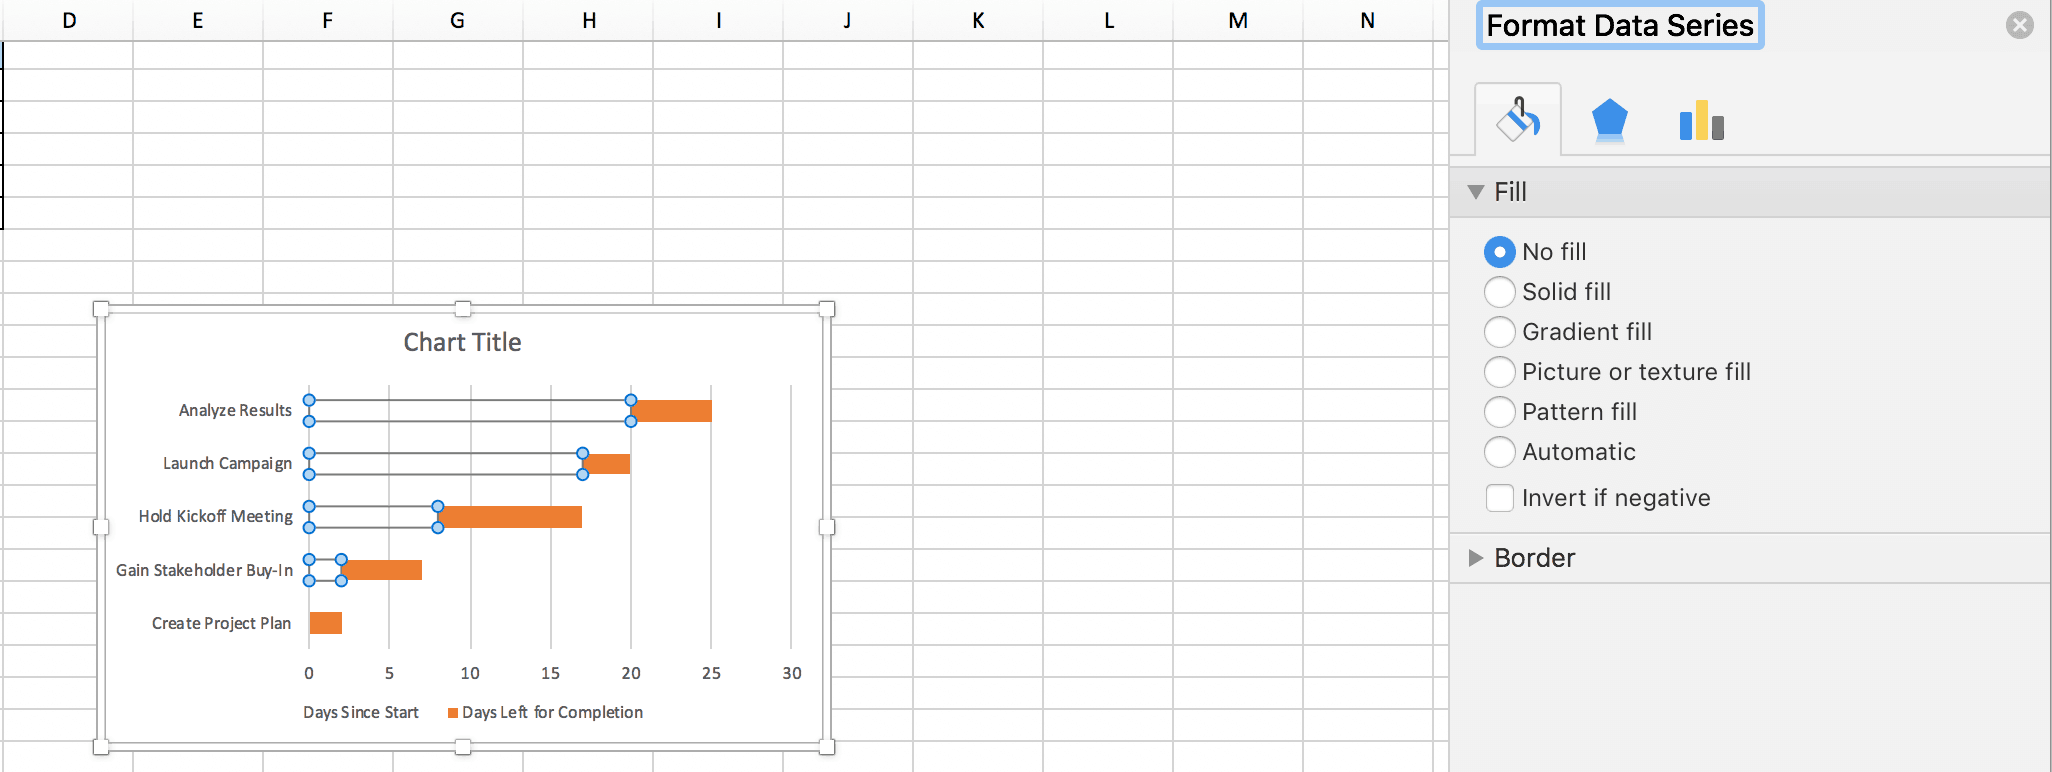
5. Format the stacked bar chart to appear more like a Gantt chart. To do so, click the first data series, or the Start Date part of the bar.
6. Click on the Format tab. Select Shape, then No Fill.
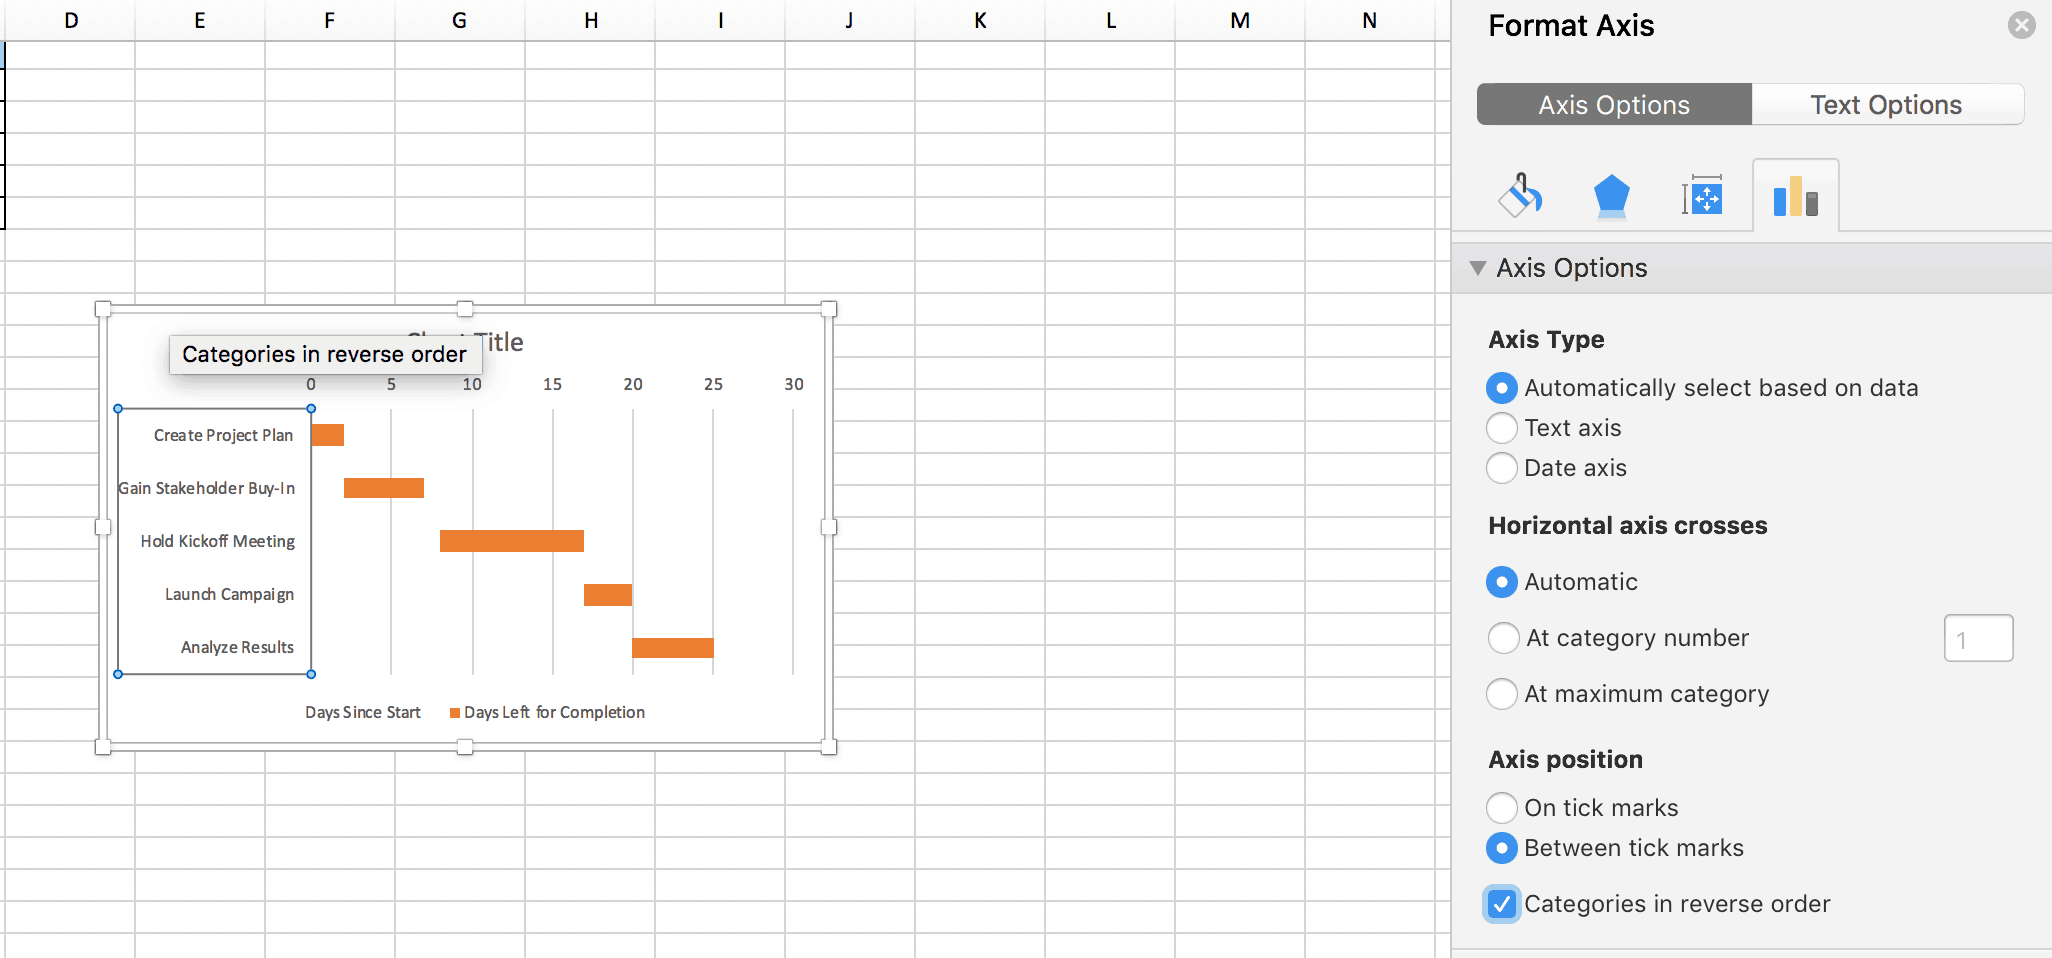
7. Reverse the task order so that the Gantt chart starts with the first task. Hold the Control key and select the Vertical Axis or the Task Axis.
8. Select Format Axis. Under the Axis Position part of the window, check the box for Categories in Reverse Order.
9. Add a chart title by double clicking on the text box titled Chart Title at the top of the chart.
10. Format the axis title and color by double clicking on either axis. A popup window will open on the right side of the screen for you to edit the colors and lines of the axis.
11. Further customize the chart by adding gridlines, labels, and bar colors with the formatting tools in Excel.
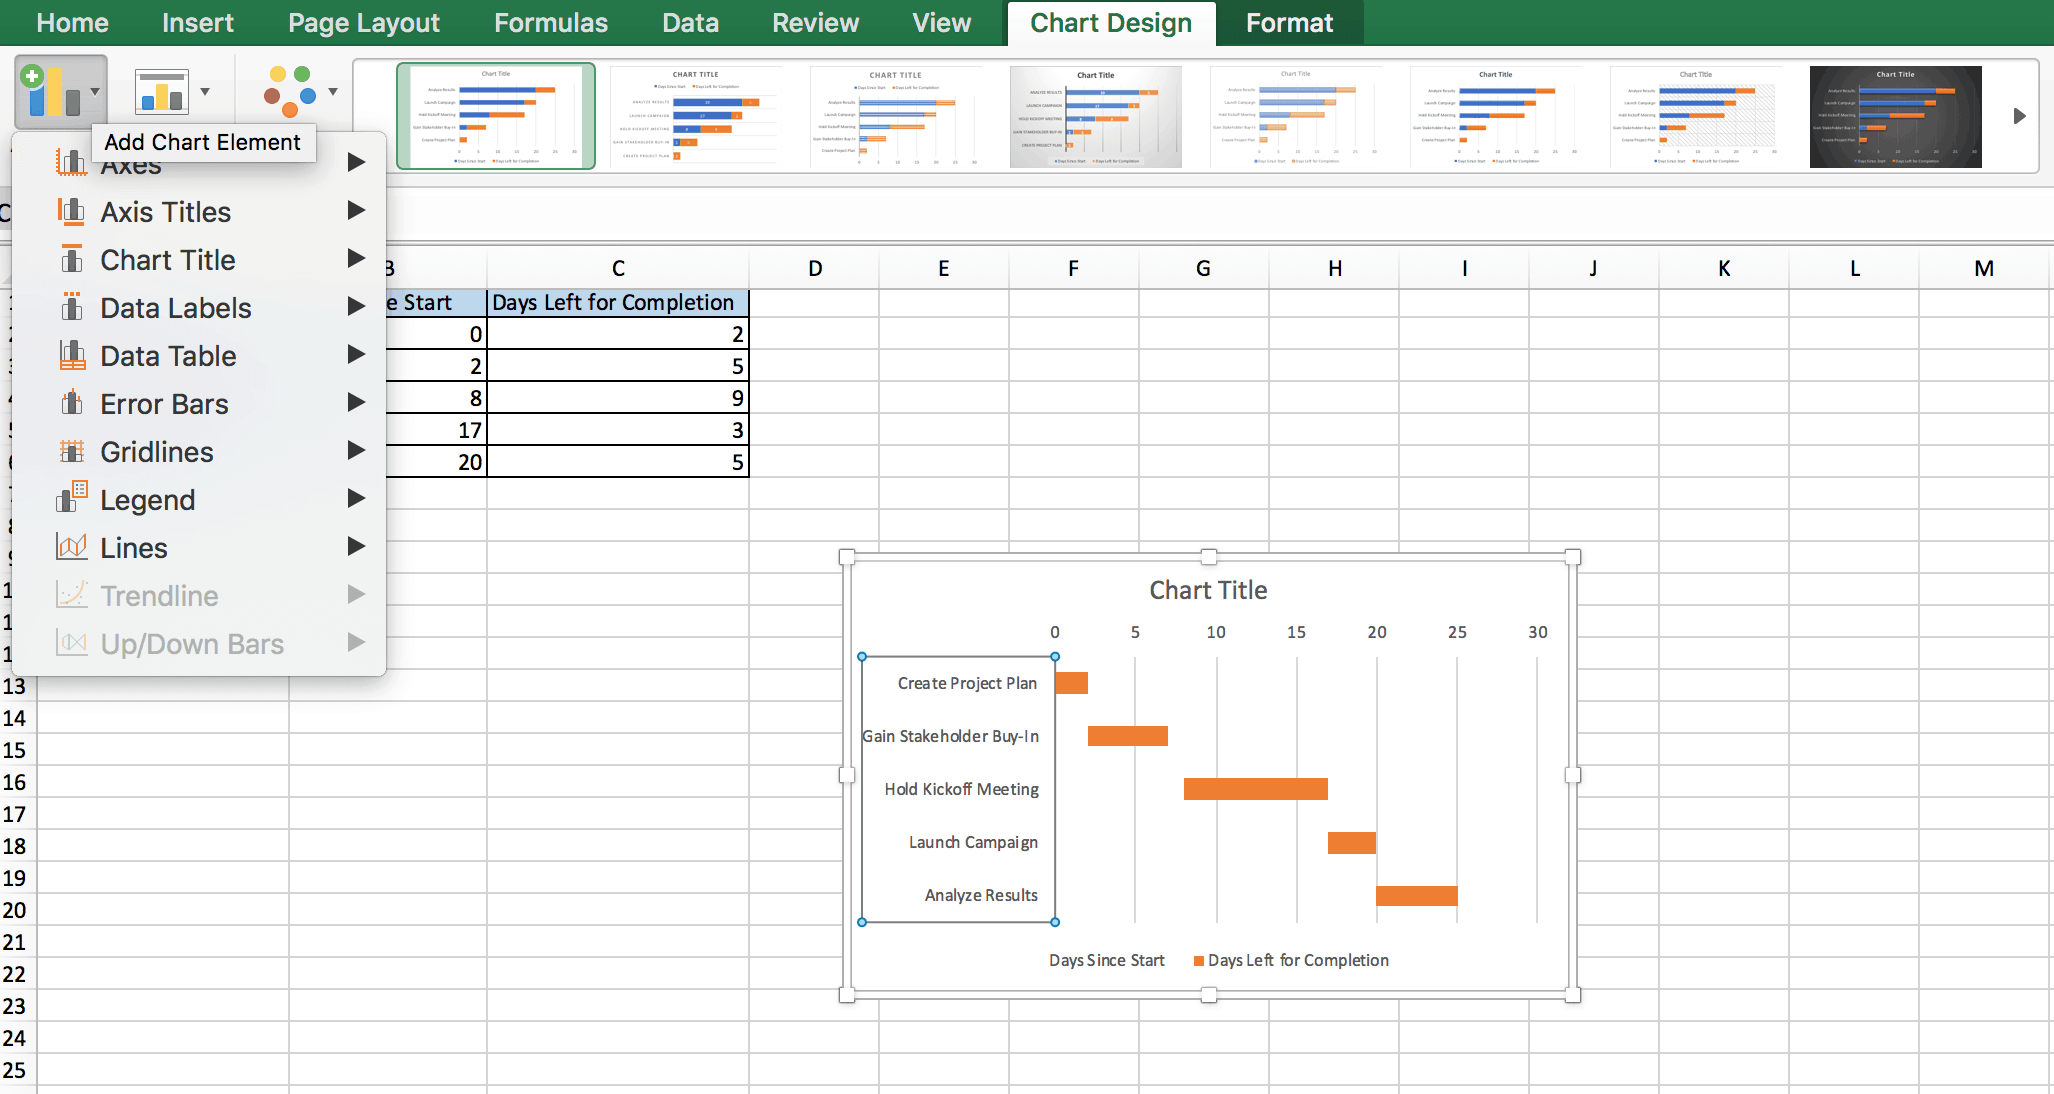
12. To add elements to your chart (like axis title, date labels, gridlines, and legends), click the chart area on the Chart Design tab at the top of the navigation bar. Select Add Chart Element, located on the far left side of the page.
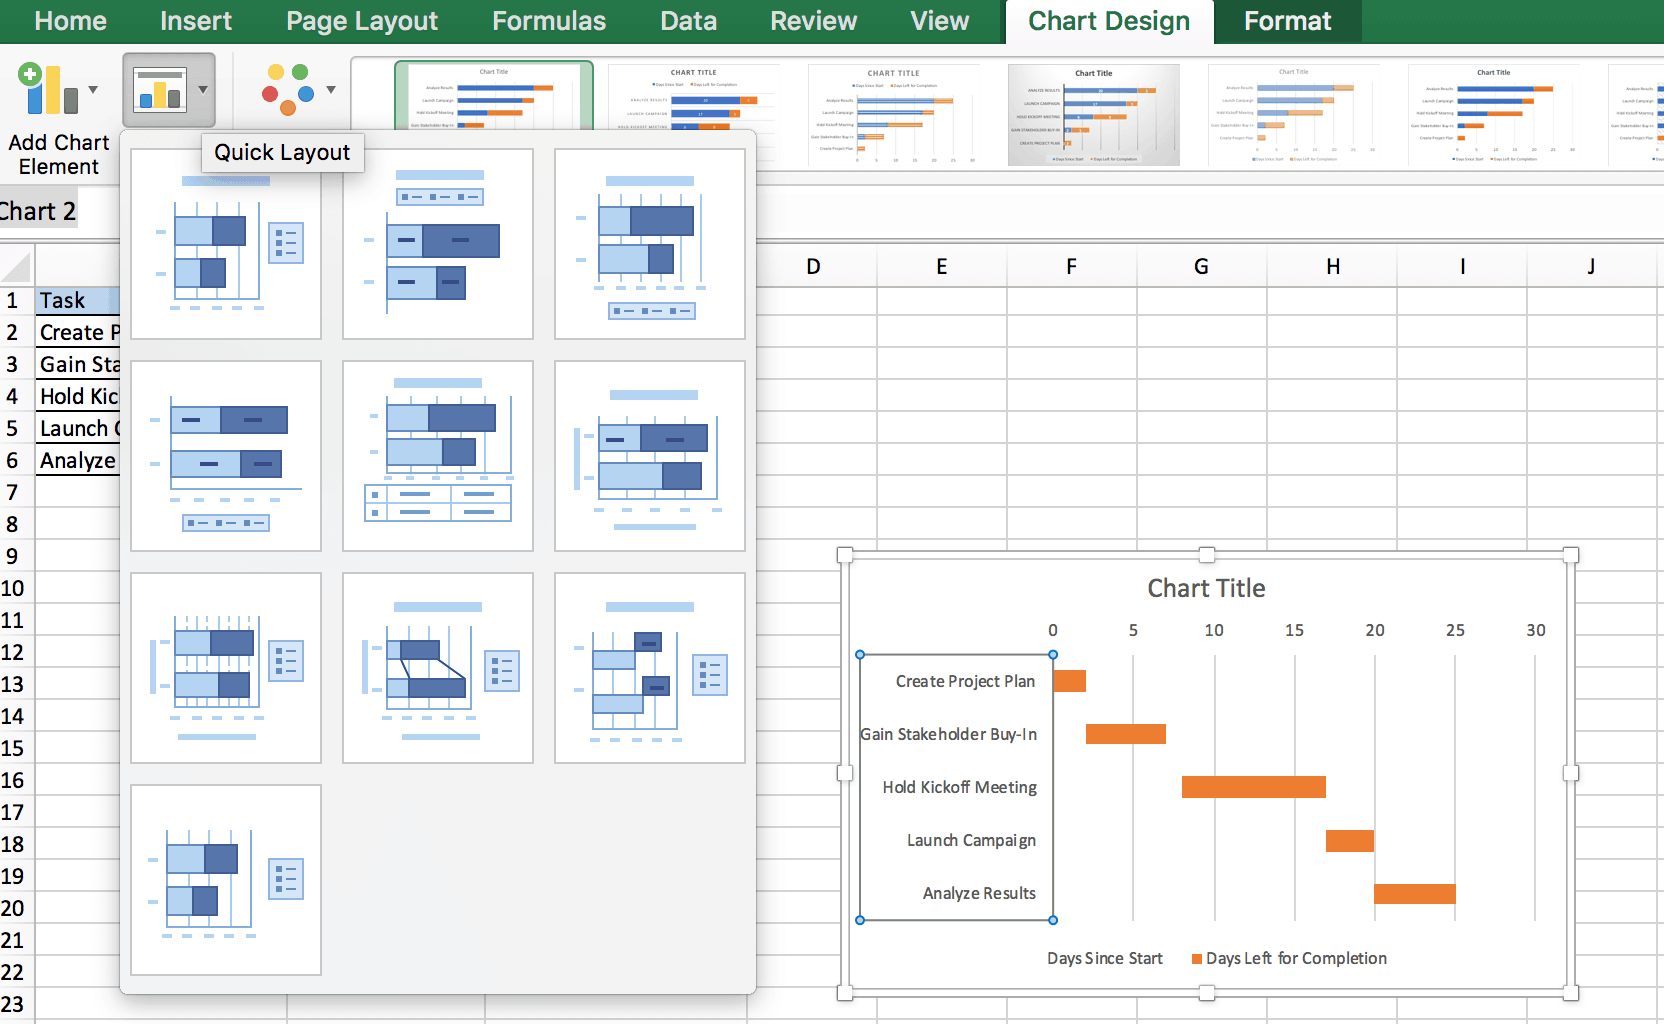
13. To quickly change the layout of your Gantt chart, navigate back to the Chart Design tab and click on the Quick Layout button.
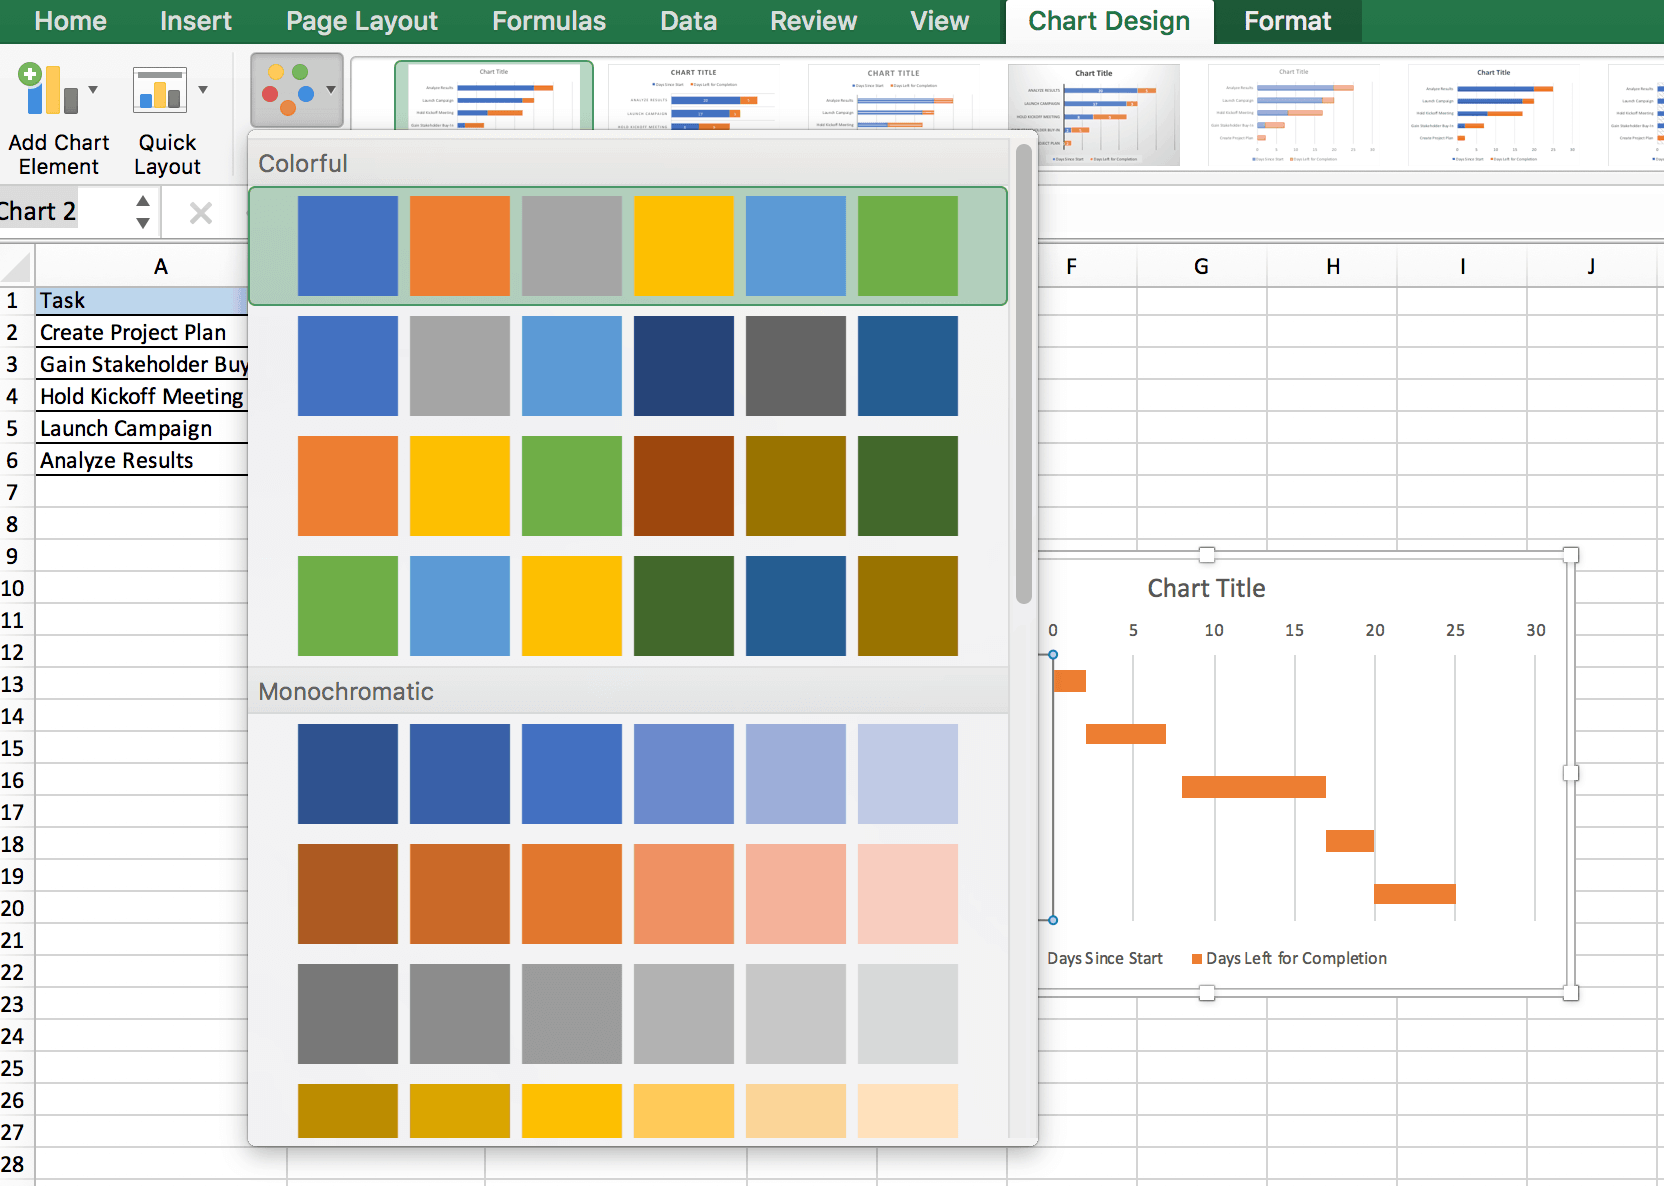
14. To change the colors within your chart, navigate back to the Chart Design tab, and click the Change Colors button.
At this point, you should have a Gantt chart that accurately depicts the start and end dates of your project tasks. As a result, you’ll also have a visual representation of your project.
You can use these steps to create Gantt charts for projects of all types and sizes based on your business needs.
The Pros and Cons of Creating a Gantt Chart in Excel
If you’re thinking about creating a Gantt chart in Excel but you’re not sure if it’s right for your project, we’ve outlined some of the pros and cons of creating a Gantt chart in Excel below.
Benefits of Using Excel
The benefits of creating a Gantt chart in Excel include the ability to store all project information on one screen and the ease of use. Let’s look at these benefits in more detail:
- Store all project information in one screen: With an Excel spreadsheet, all your project information is in one location. You can simply open the spreadsheet, and voilà — you’ll see all your project tasks, deadlines, and milestones.
- Excel is easy to use: When it comes to manually creating a Gantt chart, Excel is a fairly easy-to-use program. Simply add your date range to the spreadsheet, highlight the information, and choose the Chart Wizard button to add it all to a Gantt chart. Then, you can customize the chart to suit your project.
Downsides of Using Excel
Although Excel is a straightforward program for manually creating a Gantt chart, there are some drawbacks, namely that it is difficult to keep up to date, doesn’t allow you to assign tasks, and is difficult to collaborate in.
- It’s tricky to keep it up to date: Excel isn’t a cloud-based platform, which means that project information doesn’t update in real time, across devices. To update your team, you’ll have to manually send them the most up-to-date version of your static spreadsheet. This makes it harder for project teams to remain on the same page, and can present version control issues.
- You’re unable to assign tasks: In older versions of Excel, project teams can’t assign tasks to other users. This makes it hard for team members to know what they need to do and what their team members are working on. With an online platform, however, you can assign tasks.
- It’s hard to collaborate with your project team: Excel can make it difficult for project teams to collaborate while the project is live. As mentioned, Excel Gantt charts aren’t accessible online, meaning that project teams can’t instantly access the project in real time.
Online Gantt Chart Software: An Alternative to Excel
If you want to improve collaboration and provide real-time access to project progress, using online Gantt chart software is a step in the right direction. Online Gantt chart software allows you to create, share, and manage your Gantt chart virtually.
Online solutions provide an accessible location for your entire project team to get real-time access to project progress. Depending on the platform you choose, you can assign tasks to team members, add comments to the chart, and send messages to other users to streamline collaboration.
For detailed insight on To find out what to look for when choosing the a Gantt chart software, visit take a look at our article on quick and easy Gantt chart software, tools, and apps. And, i If you’re looking for additional Gantt chart Excel templates for a variety of use cases, download our free Gantt chart Excel templates.
Why Is Online Gantt Chart Software Helpful for Project Teams?
The benefits of using Gantt chart software include the abilities to easily make changes, access the most up-to-date version, identify the critical path, and track progress in real time.
Let’s take a look at these benefits in greater detail:
- Easily make changes in real time: With an online Gantt chart, it’s easy to make changes to your project schedule in real time. For example, you can typically drag and drop tasks to make changes to the start and end dates — what’s more, changing the dates of your project tasks will often also automatically update the rest of the project. For instance, if a task deadline moves forward by a week, the rest of the project (and any dependent tasks) will also be updated.
- Always access the most up-to-date version: An online Gantt chart will instantly reflect any changes made to it. This means that anyone who views the chart knows that they’re looking at the most current version, which cuts down on version control issues and reduces the likelihood of team members working from outdated information.
- Identify the critical path: The critical path is the longest sequence of dependent tasks that must take place for the project to finish on time. With an online Gantt chart, it’s easy to spot, highlight, and track your critical tasks. You can see how your critical path is performing in real time and prioritize critical tasks if things aren’t going to plan.
Create Your Real-Time Gantt Chart in Smartsheet
Creating a Gantt chart in Smartsheet is an easy way to ensure that your real-time project status and schedule are easy to read and accessible to stakeholders from anywhere. We’ll walk you through how to create an effective Gantt chart from a template in Smartsheet in the steps below.
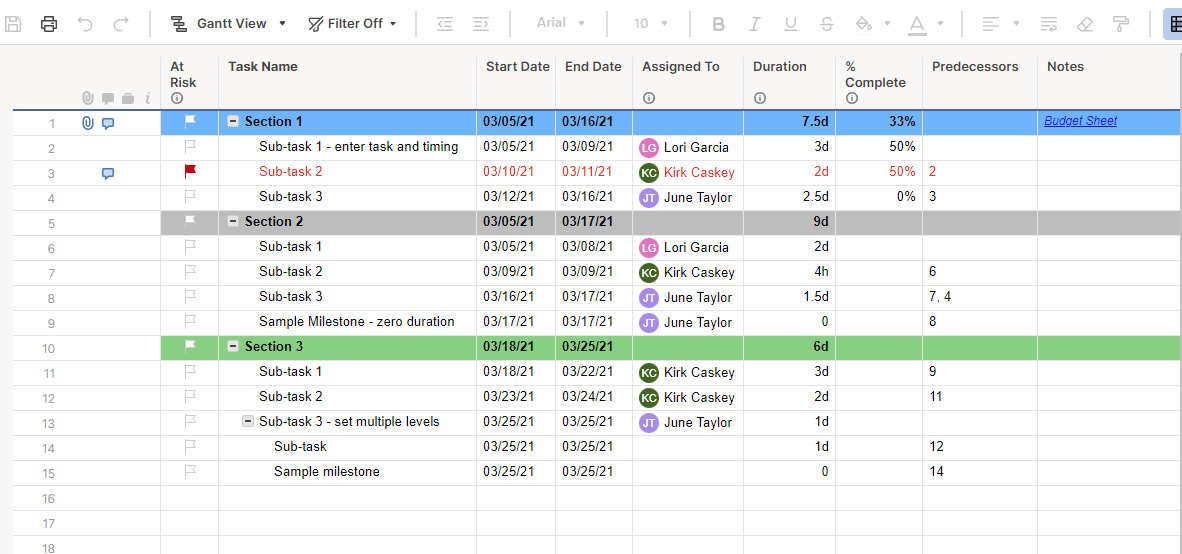
1. Find a template that suits your needs in the Smartsheet Solution Center using the search bar at the top of the page. The Smartsheet Solution Center is home to more than 175 different templates, many of which include Gantt charts and other project management tools. In this walkthrough, we’ll use the Project with Gantt & Dependencies template. This template comes preformatted with sample data to get you started, but it is easy to add your own.
2. Log into your Smartsheet account and add the template to your Sheets folder. Then, click on the name of the template to open it.
3. First, customize the tasks within the Task Name column by clicking within the cell and entering your project tasks and phases.
4. Then, choose start and end dates for each task, and assign each one to the team member responsible for it.
5. Next, add project dependencies by entering the row number of dependent tasks in the Predecessors column. This will create arrows between dependent tasks on your Gantt chart.
6. You can also flag at-risk tasks, and enter the % Complete of each task as the project progresses.
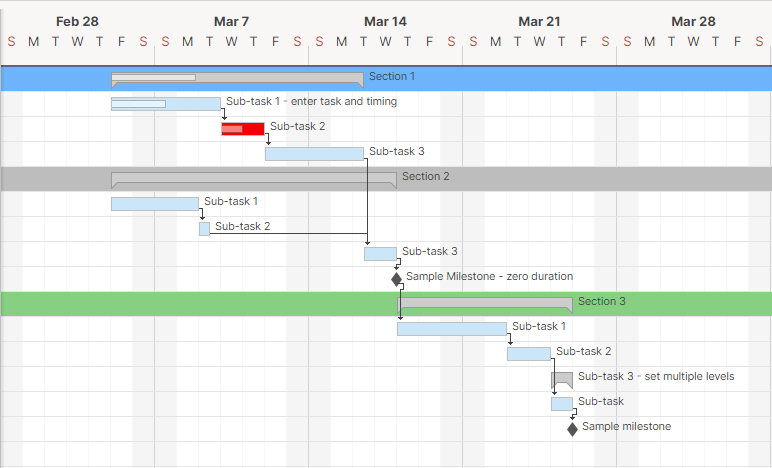
With this data filled in, Smartsheet will automatically create a Gantt chart on the right side of the template.
7. Smartsheet also allows you to adjust project information within the Gantt chart directly. To adjust the start or end date of a task, hover your mouse over the left or right side of the task bar until the two way arrow icon appears. Then, click and drag the edge of the task bar to the desired date.
To move a task to a different date but keep the original task duration intact, click within the center of the task bar and drag it from its existing range to the new date range.
Using either of these options will update the start and end date columns for each task on the left side of the template automatically.
You can also change the colors of individual tasks by right clicking the bar and choosing a new color in the Color Settings menu.
8. Once you’ve filled in your project task list and customized the Gantt chart colors, attach additional project documents as needed to the relevant rows, or add context and reminders in the Notes column. You can also upload a proof to review multimedia elements, or automate reminders for your team as deadlines appear or when new information is added.
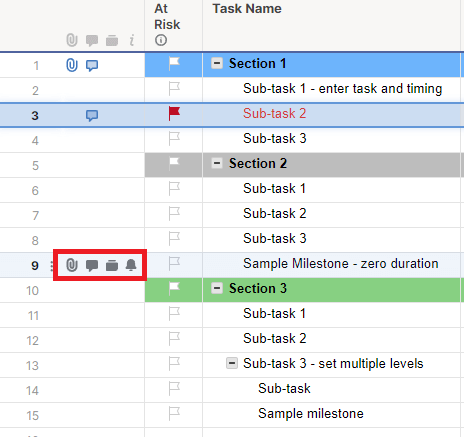
Hover your mouse over a row to reveal four icons on the left-hand side. Use these icons to Attach a file to this row, Add a comment, Add a proof, or Set a reminder.
9. When your Gantt chart is complete, save it and share it with your team. Any changes you make over the course of the project will be automatically reflected to anyone with access to the sheet, ensuring that they always have the most up to date project information.
Improve Project Visibility with Real-Time Gantt Charts in Smartsheet
Empower your people to go above and beyond with a flexible platform designed to match the needs of your team — and adapt as those needs change.
The Smartsheet platform makes it easy to plan, capture, manage, and report on work from anywhere, helping your team be more effective and get more done. Report on key metrics and get real-time visibility into work as it happens with roll-up reports, dashboards, and automated workflows built to keep your team connected and informed.
When teams have clarity into the work getting done, there’s no telling how much more they can accomplish in the same amount of time. Try Smartsheet for free, today.

